- Avalanche price fades recovery from a multi-day low, but stays within a bullish triangle.
- Sustained bounces from the 50-day SMA, and clear trading within a month-old triangle keep AVAX buyers optimistic.
- Despite bearish RSI and MACD signals, multiple downside supports and strong fundamentals keep Avalanche buyers hopeful.
- AVAX can reverse yearly loss on upside break of $30.60, while bears remain cautious beyond $22.90.
Avalanche (AVAX) posts mild losses around $28.50 early Thursday, reversing the previous day’s corrective bounce from a month’s low.
In doing so, the altcoin fades bounces off a month-old triangle’s support, but stays beyond the 50-day Simple Moving Average (SMA). Despite this, the pullback lacks support from trading volume, even as momentum indicators like the 14-day Relative Strength Index (RSI) and the Moving Average Convergence Divergence (MACD) flash bearish signs.
According to Santiment, Avalanche’s daily trading volume extends a pullback from a week’s top, down for the second consecutive day, while easing to $656.32 million. Furthermore, the market capitalization (market cap) has dropped back toward the month’s low, marked on Tuesday, and is now at $12.02 billion. This suggests weaker trader participation, challenging the AVAX pullback.
Additionally, several downside supports and a month-old bullish triangle formation keep Avalanche buyers hopeful of reversing the yearly low, as long as it stays beyond $22.90.
Also read: AVAX News Today: Price May See 10% Correction Despite Strong Fundamentals
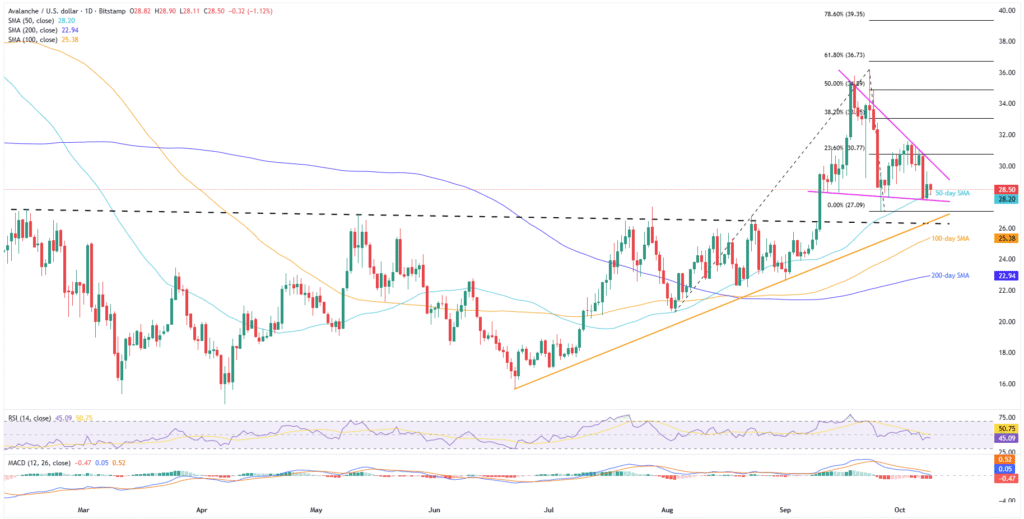
Avalanche Price: Daily Chart Highlights Bearish Consolidation

A sustained reversal from a triangle’s bottom and the 50-day SMA jostle with the bearish MACD signals and weak RSI conditions to suggest a gradual recovery for AVAX rather than a sharp rally.
This highlights the $30.00 round figure as an immediate resistance ahead of the stated triangle’s top, surrounding $30.40.
Notably, a break above $30.40 could push AVAX toward the $38.00 target, marking the bullish triangle breakout.
As AVAX rises, $31.50 and September’s high near $36.18 may act as intermediate halts. That said, the 78.6% Fibonacci retracements of the AVAX August-September moves, near $39.35, and the $40.00 threshold could lure the bulls afterward.
Meanwhile, the 50-day SMA and the stated triangle’s support, close to $28.15 and $27.80, restrict Avalanche’s short-term downside.
Below that, a convergence of the previous resistance line from February and an ascending trendline from late June, around $26.30, will be a tough nut to crack for the AVAX bears. Further, a break below $26.30 could direct AVAX toward the 100-day and 200-day SMAs, at $25.35 and $22.90 in that order, acting as the final defense of the bulls.
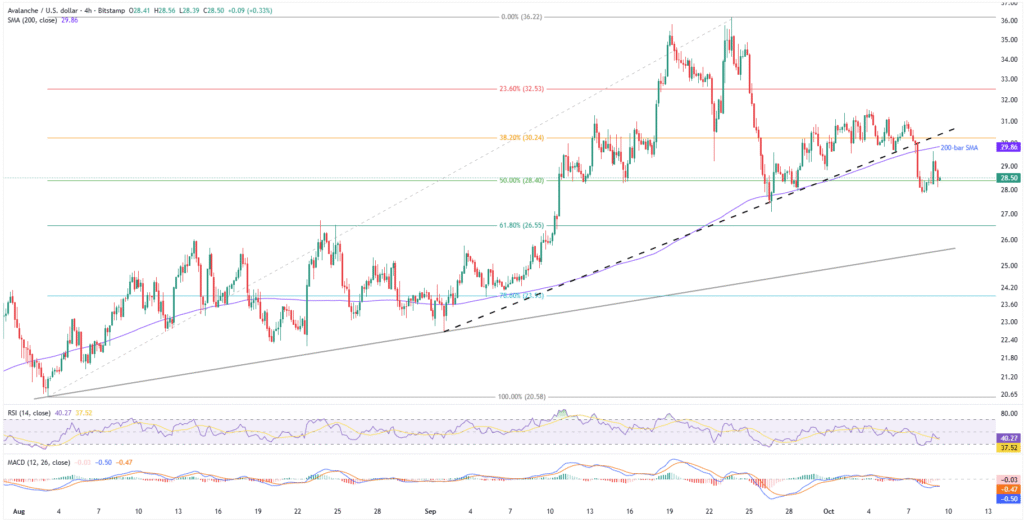
Avalanche Price: Four-Hour Looks Slightly Bearish

On the four-hour chart, AVAX pullback struggles with the 50% Fibonacci retracement of August-September upside, near $28.40.
The RSI and MACD show even stronger bearish signals on the shorter-term chart. Further, a clear break below early September’s support and a reversal from the 200-bar SMA resistance add weight to the short-term downside outlook.
This highlights the 61.8% Fibonacci ratio surrounding $26.55, also known as the “Golden Fibonacci Ratio”, which precedes a two-month-old ascending trendline, near $25.50, to restrict short-term AVAX downside before the deeper levels discussed on the daily chart.
On the contrary, the 200-bar SMA and a five-week-old previous support line, respectively near $29.85 and $30.40, guard immediate AVAX upside during a fresh rally. That said, the $30.00 psychological magnet also acts as an additional upside-down filter.
Notably, the quote’s sustained trading above $30.40 enables it to target the higher levels on the daily chart.
Conclusion
Despite the latest pullback, Avalanche maintains a bullish chart pattern and recovery from the 50-day SMA. While the momentum is weak, strong downside support and positive ecosystem fundamentals keep buyers hopeful of reversing the current 20% yearly loss.
Additionally, the latest improvement in investor confidence towards cryptocurrencies also reinforces the bullish bias about AVAX.


