- Avalanche price stays sideways, making rounds to the 200-day SMA for the third straight day.
- Higher lows, a nearly oversold RSI, and weakening bearish MACD underpin AVAX recovery hopes.
- Daily close beyond the weekly top becomes necessary to convince Avalanche buyers.
- AVAX bears need validation from $20.20 to hit a fresh monthly low.
- Avalanche’s potential short-term recovery can restore a broad bullish trend on crossing $29.00.
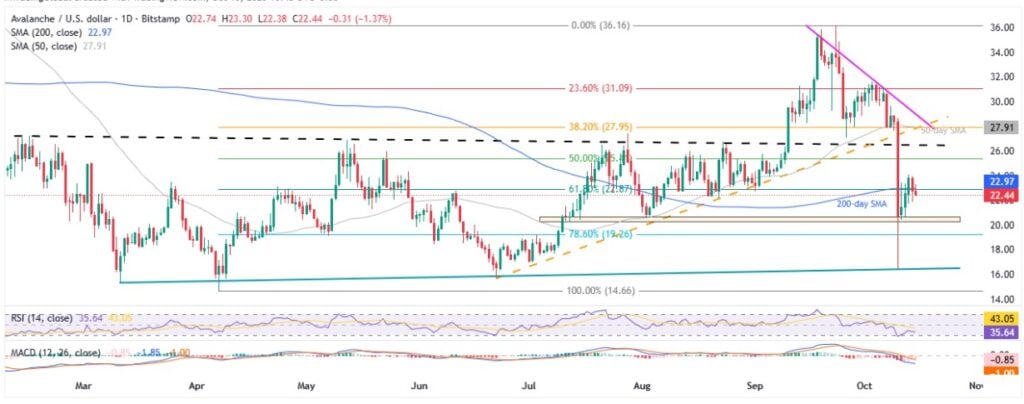
Avalanche (AVAX) seesaws around $22.60 early Wednesday, mildly offered while portraying its third daily round to the 200-day Simple Moving Average (SMA).
Irrespective of the quote’s slight weakness, AVAX lacks bearish momentum as the 14-day Relative Strength Index (RSI) approaches the oversold territory, whereas the Moving Average Convergence Divergence (MACD)shows weakening downside bias.
Adding strength to Avalanche’s recovery hopes is the higher-low price action and downbeat trading volume during the latest fall, despite a pullback in the market capitalization (market cap).
Notably, Avalanche’s daily trading volume hits a six-day low of $988.24 million, while the market cap defends the previous day’s pullback from a week’s high to $9.63 billion, according to Santiment.
Also read: House Republicans Move to Cement Trump’s Bitcoin-Backed Retirement Policy
With this, AVAX is likely to witness a short-term recovery in prices, but the resumption of the broad bullish trend needs a strong catalyst and $29.00 breakout to convince bulls.
Avalanche Price: Daily Chart Lures Buyers

Avalanche seesaws around the key SMA and the 61.8% Fibonacci Retracement of its April-September upside over the last three consecutive days.
The quote’s lower-high formation since Friday, however, joins the RSI line’s proximity to the 30.00 oversold limit, and the weakening bearish MACD signals to hint at a slow recovery in prices.
Still, a daily closing beyond Monday’s peak of $24.08 becomes necessary for the AVAX bulls to return.
Even so, the 50% Fibonacci ratio and previous support line from April, respectively near $25.40 and $26.60, could challenge the buyers.
Beyond that, the $27.90-$27.95 region, comprising the 38.2% Fibonacci retracement, 50-day SMA, and an ascending trendline from late June, will be a tough nut to crack for Avalanche buyers.
Above all, a daily closing beyond a month-long resistance line, close to $29.00 by press time, can trigger the AVAX rally targeting the previous monthly high near $36.20 and reverse the yearly loss.
On the flip side, a three-month horizontal support area between $20.20 and $20.70 restricts the altcoin’s short-term downside before the $20.00 threshold and the 78.6% Fibonacci ratio of $19.26.
Should AVAX bears keep reins past $19.26, an ascending support line from March, close to $16.40 as we write, and the yearly low of $14.67 will be in the spotlight.
Avalanche Price: Four-Hour Highlights Gradual Recovery

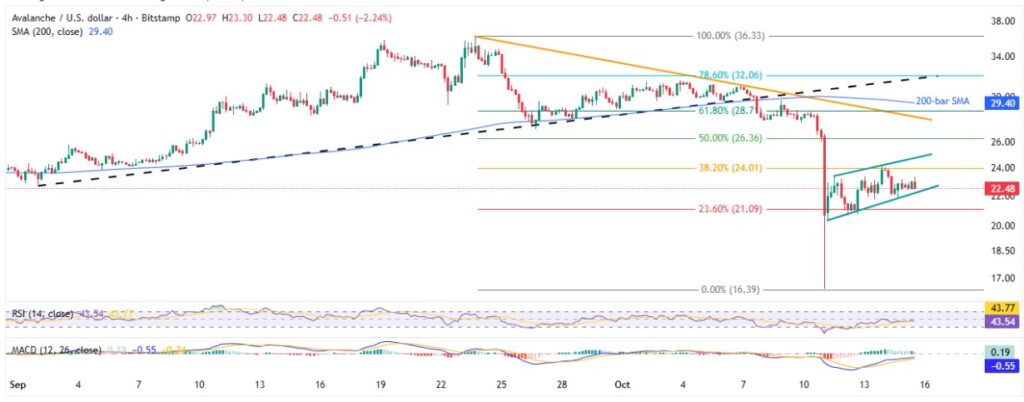
Despite the latest inaction, Avalanche holds onto a four-day recovery formation, highlighted by a short-term ascending trend channel, currently around $24.80 and $22.10.
The bullish chart pattern gains support from an upbeat RSI and bullish MACD signals (green histograms) to lure buyers.
Beyond that, a three-week trend line resistance surrounding $28.20, the 200-bar SMA hurdle of $29.40, and the previous support line from early September, near $31.90, could test the bulls.
Alternatively, a downside break of $22.10 could revisit the 23.6% Fibonacci retracement of AVAX’s downturn from September 23 to October 10, close to $21.10.
After that, the $20.30 and the $20.00 round figures may stall the sellers before directing them to Friday’s low of $16.40 and deeper levels discussed on the daily chart.
Conclusion
Avalanche’s recent price action suggests a short-term recovery, backed by bullish channel formation and momentum indicators like the 14-day RSI and MACD. The altcoin’s reversal of the yearly loss, currently around 36%, however, needs strong fundamental catalysts and a daily closing beyond $29.00.
Also read: Cryptocurrency Weekly Price Prediction: BTC, ETH & XRP Plummet under U.S. Risk Pressure


