- Avalanche price dribbles below key short-term resistance, testing the strength of its three-month uptrend.
- Strong recovery from the 50-day EMA, combined with a neutral RSI, supports AVAX buyers.
- A convergence of 10-day EMA and 38.2% Fibonacci retracement guards Avalanche’s immediate upside.
- AVAX’s $35.50 breakout could reverse yearly loss, while a drop below $25.00 would signal a bearish shift.
- Short-term bullish trend prevails within a broader consolidation pattern.
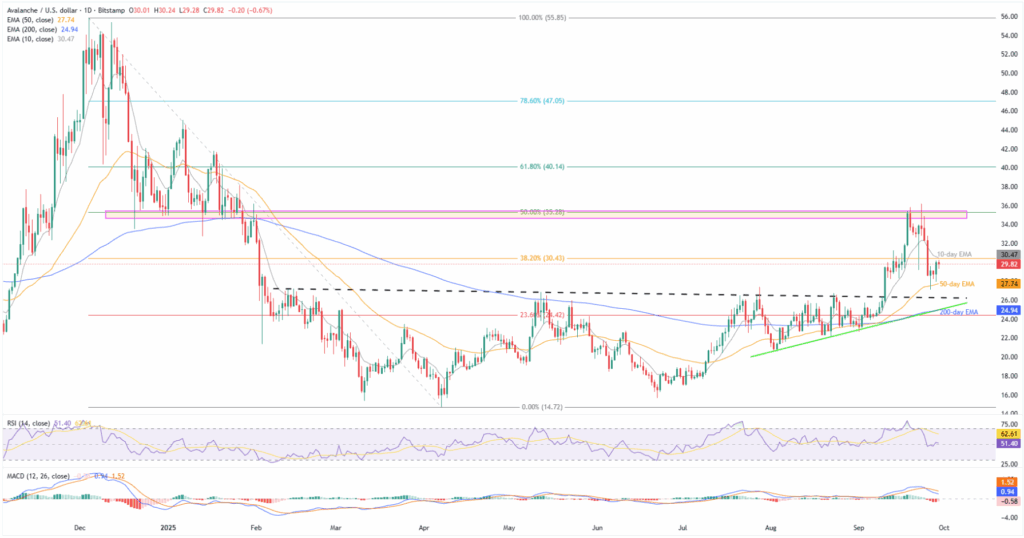
Avalanche (AVAX) faces modest losses around $29.80 early Monday, struggling to defend the biggest daily jump in over a week amid mixed market sentiment. In doing so, the altcoin fluctuates between the 50-day and 10-day Exponential Moving Average (EMA), staying on the cusp of posting a three-month uptrend.
Despite the AVAX’s latest consolidation, the quote’s sustained trading beyond the 50-day EMA, backed by neutral conditions of the 14-day Relative Strength Index (RSI) momentum indicator, keeps buyers optimistic.
On the same line is the upbeat trader participation during the quote’s recovery since Friday, as reflected through sturdy trading volume. Still, a pullback in the market capitalization (market cap), bearish signals from the Moving Average Convergence Divergence (MACD) momentum indicator, and a convergence of the 10-day EMA with the 38.20% Fibonacci retracement of its December-April fall, challenge the short-term AVAX bulls.
According to Santiment, Avalanche’s daily trading volume hit a three-day high of $1.10 billion, whereas the market cap retreated to $12.58 billion from Sunday’s high of $12.67 billion.
AVAX’s three-month uptrend could accelerate and challenge its yearly loss if it breaks $30.50, with a stronger push above $35.50. However, $25.00 remains a crucial downside support to watch. Read Why?
Avalanche Price: Daily Chart Highlights Broad Consolidation Pattern

A clear reversal from the 50-day EMA and neutral RSI line, surrounding the 50.00 level, allows the AVAX buyers to remain hopeful of crossing the immediate $30.50 upside hurdle, comprising the 10-day EMA and the 38.2% Fibonacci ratio.
Beyond that, the $32.80 mark could attract bulls, but they’ll face a key resistance around $34.65-$35.50, which includes levels from the past nine months and the 50% Fibonacci retracement.
In a case where the AVAX manages to offer a daily closing beyond the $35.50, the odds of witnessing a rally toward reversing the yearly loss, currently around 16.50%, can’t be ruled out. This highlights the 61.8% Fibonacci ratio near $40.15 and the yearly peak of $45.05.
Alternatively, a daily closing beneath the 50-day EMA support of $27.70 isn’t an open invitation to the AVAX bears, as the previous resistance line from February, around $26.30, can test the downside moves.
More importantly, a convergence of the 200-day EMA and an ascending trend line from early August, close to $25.00, will be the final defense for Avalanche buyers, a break of which could drag prices toward the yearly low of $14.67. During the anticipated fall, lows marked in August and June, close to $20.60 and $15.64, may act as buffers.
Avalanche Price: Four-Hour Looks More Bullish

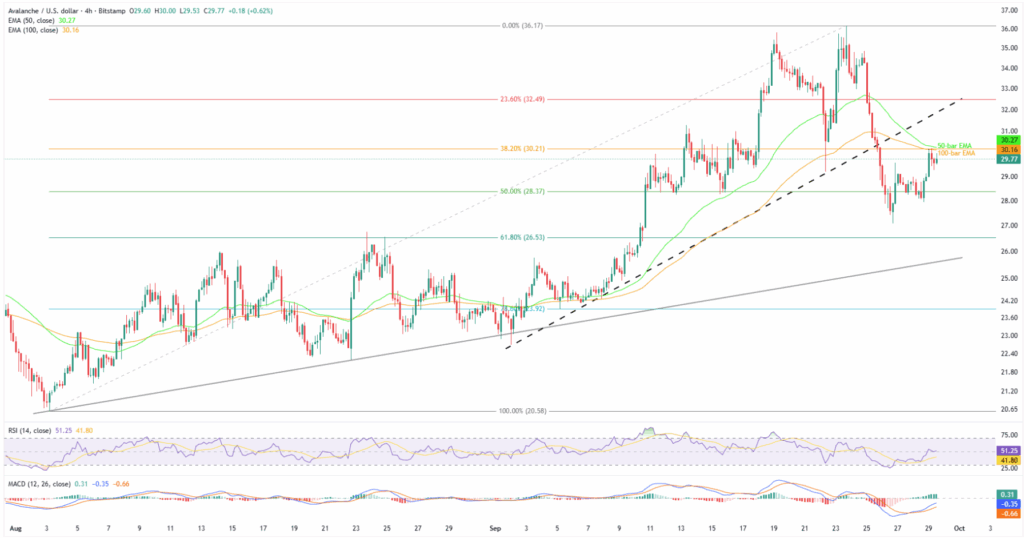
On the four-hour chart, Avalanche shows a more bullish trend, backed by upbeat RSI and bullish (green) MACD signals. However, a convergence of the 50-bar and 100-bar EMAs restricts short-term AVAX upside near $30.15-$30.30, just beneath the $30.50 hurdle stated on the daily chart.
Avalanche’s upside past $30.50 could aim for the previous support line from September 02, close to $31.95, before shifting the market’s attention to higher levels discussed on the daily chart.
Meanwhile, fresh downside could aim for last week’s low of $27.09 and then an ascending support line from August, near $25.60 as we write.
Should AVAX remain weak past $25.60, the odds of witnessing a gradual run-up toward the yearly low, with the daily chart’s intermediate halts, can’t be ruled out.
Conclusion
Avalanche price continues to defend its six-month trading range, despite rising in the last three consecutive months. This highlights the importance of short-term key resistances amid positive news surrounding the Avalanche ecosystem.
Also read: Crypto Weekly Price Prediction: BTC, ETH & XRP all Tumble as U.S. Data Fuels Dollar, NFP Eyed


