- Binance Coin price stays downbeat after reversing from an all-time high and snapping an eight-day winning streak.
- Weak breakout above 2024 highs; overbought RSI signals a short pause before BNB bulls resume rally, targeting $890.
- Holding above key SMAs, old resistance, and bullish MACD boosts overall BNB/USD optimism..
Binance Coin price (BNB/USD) fell over 3% to $748 on Thursday after reversing from its all-time high of $810 and ending an eight-day winning streak the previous day, sparking fears of a “fake breakout.”
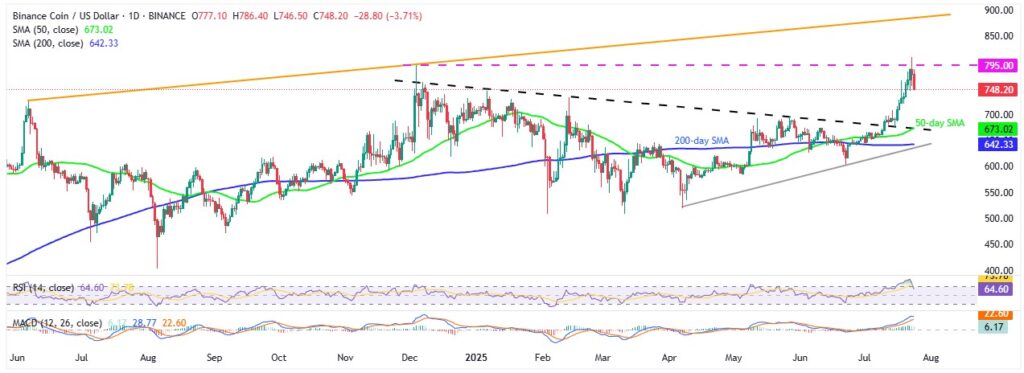
The pullback was likely triggered by overbought conditions in the 14-day Relative Strength Index (RSI) after failing to hold above the 2024 high. However, BNB trades above key Simple Moving Averages (SMA) and the December 2024 resistance line, now acting as support, while bullish Moving Average Convergence Divergence (MACD) signals keep traders optimistic for a fresh rally.
BNB/USD: Daily Chart Resists Welcoming Bears

Binance Coin (BNB) pulled back briefly from its record high due to an overbought 14-day RSI but remains bullish, holding key resistances like the December 2024 descending trendline.
Strong support from MACD and SMAs also favors BNB/USD buyers.
That said, a daily close below January’s $745 high could push sellers toward February’s $732 top and the $700 psychological level. Further weakness may test the $673-$671 zone (50-day SMA), then $642 (200-day SMA), and $632 ascending trendline.
On the upside, a close above $795 could reignite momentum toward the $810 all-time high, before an ascending resistance line from June near $890, the $900 round-figure, and the $1,000 psychological mark.

BNB/USD: Four-Hour Chart Suggests Short-Term Downside Pressure
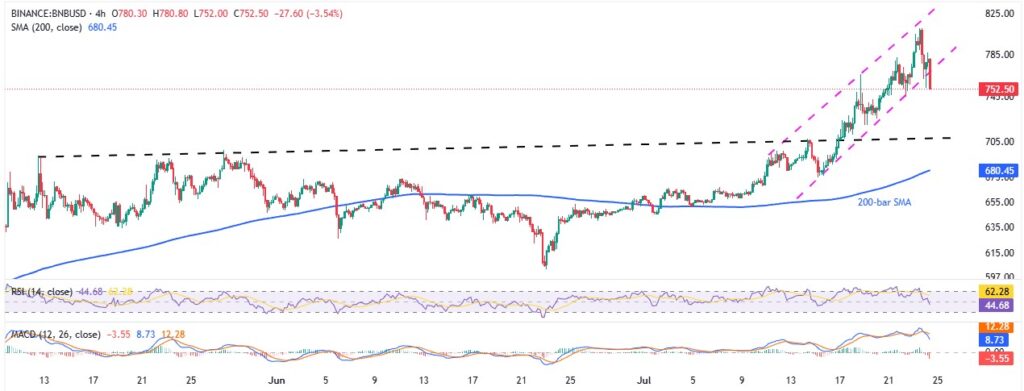
On the four-hour chart, RSI falls below the 50.00 neutral line, signaling weak momentum during BNB’s recent drop.
That said, the downside break of the ascending trend channel from July 11, between $763 and $820, combined with bearish MACD signals, attracts short-term sellers.
A clear break below $763 shifts focus to May’s previous resistance line from December near $708 and the 200-bar SMA around $680, before daily chart support zones come into play.
To recover, BNB must hold above the $763 support-turned-resistance line to target the channel top near $820. Key upside hurdles include December 2024’s peak near $795 and the recent top at $810. A successful breakout above $820 clears the path toward $890 and potentially higher levels, as noted in the daily outlook.
Overall, despite a recent dip signaling a short-term correction, Binance Coin (BNB/USD) remains bullish and on track for new all-time highs in the medium to long term.


