- Binance Coin price extends week-start pullback from all-time high, printing a five-day downtrend.
- Head-and-shoulders confirmation on the four-hour chart could boost BNB’s short-term bearish outlook.
- RSI and MACD conditions suggest downside of the BNB/USD pair, but the broad uptrend’s reversal is arguable.
- $650 gains seller’s attention on H&S signal; recovery needs validation from $795.
Binance Coin (BNB/USD) price drops for the fifth consecutive day while extending the week-start reversal from an all-time high (ATH), down 1.75% intraday to $769.00 as Friday’s New York trading bell rings.
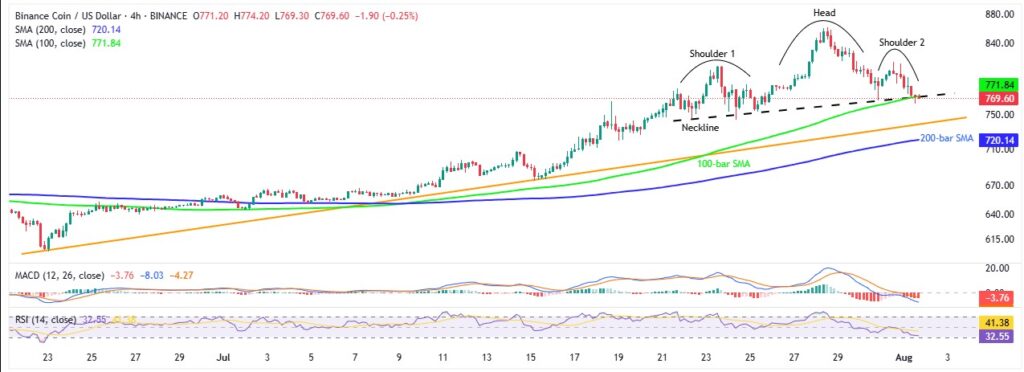
Apart from a failure to refresh the ATH, the BNB/USD pair sellers also cheer a near confirmation of the Head-and-Shoulders (H&S) bearish chart pattern on the four-hour projections. Adding strength to the downside bias is the 14-day Relative Strength Index (RSI) and the Moving Average Convergence Divergence (MACD) indicator.
It should be noted, however, that a slew of strong downside support and the RSI’s proximity to the oversold territory might challenge the BNB bears during their further dominance.
Binance Coin Price: Four-Hour Chart Portrays Bearish H&S

A week-long Head-and-Shoulders (H&S) pattern draws the BNB/USD pair seller’s attention as they poke the $771.00 support confluence, eyeing confirmation of the bearish setup. Adding strength to the downside bias are the bearish MACD signals and a descending RSI line that remains above oversold territory, suggesting further room towards the south.
It’s worth mentioning that the BNB’s latest downtick beneath the $771.00 key support can’t confirm the H&S unless marking a sustained trading beneath the same.
With this, the BNB is likely to break the $771.00 key support, comprising the H&S Neckline and the 100-bar Simple Moving Average (SMA), which in turn offers a theoretical target of $655.
That said, a five-week-old rising support line and the 200-bar SMA, respectively near $737.00 and $720.00, could also act as short-term support for the BNB/USD pair. Additionally, the $700.00 threshold and the mid-July bottom of $674.00 might offer further relief to the sellers past $720.00.
Alternatively, the Binance Coin’s failure to break the $771.00 key support, followed by a corrective bounce, will need validation from the December 2024 peak surrounding $795.00 to convince buyers. Even so, the $800.00 threshold, the $815.00 and the ATH of $861.20 could challenge the BNB’s further upside.
Binance Coin Price: Daily Chart Highlights More Room Towards South

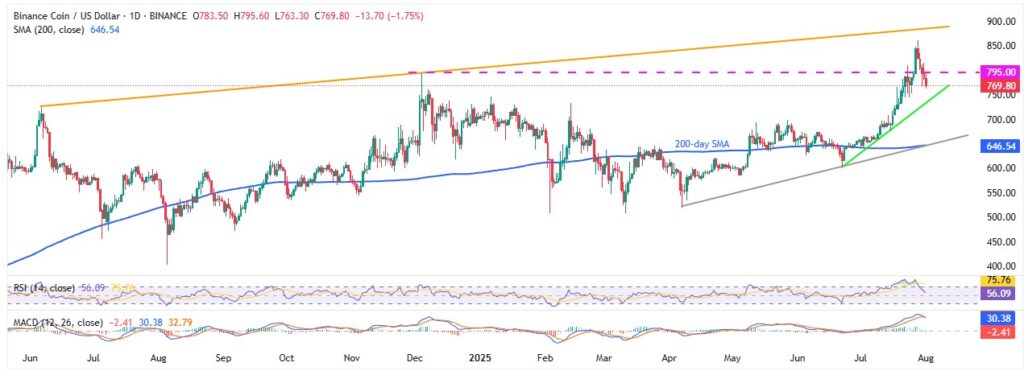
While the four-hour chart needs a clear $771.00 breakdown to convince sellers, the daily chart already favors bears after breaking the late 2024 peak near $795. Meanwhile, the RSI’s drop from overbought levels and bearish hints from the MACD indicator point to further downside for the BNB/USD pair.
That said, January’s high of $745.50 might act as an immediate support for the Binance Coin before it tests an ascending trend line from late June, near $737.00.
Should the BNB bears keep the reins past $737.00, February’s high of $732.50, the $700.00 round figure and May’s high of $697.70 could act as intermediate halts before the $646.00 support confluence encompassing the 200-day SMA and a four-month rising trend line.
On the contrary, BNB recovery should wait for a clear break above the late 2024 peak of $795.00, as well as the $800.00 threshold, before targeting the ATH surrounding $861.00. In a case where the Binance Coin remains firmer past $861.00, an upward-sloping resistance line from June 2024 surrounding $885.00 will be in the spotlight.
Conclusion
Binance Coin (BNB/USD) sellers appear well-set to confirm the short-term bearish chart formation and aim for the sub-$700 area. However, the downside room appears limited until bears break the $646.00 wall of support.


