- Binance Coin price extends its three-day rally to hit a fresh all-time high (ATH).
- Successful trading above key SMAs, technical supports and bullish channel favor BNB buyers.
- Overbought RSI, proximity to multi-month resistance could test bulls before the $900.00 mark.
- Binance Coin may enter short-term consolidation, but overall bullish trend remains intact.
Binance Coin (BNB) price refreshes its record high near $870.00 during a three-day winning streak, before easing to $861.60 ahead of Thursday’s U.S. trading session.
The BNB’s steady move beyond key Simple Moving Averages (SMAs) joins extension of early-month rebound from the key support area and bullish signals from the Moving Average Convergence Divergence (MACD) indicator to favor the buyers.
Further, Binance Coin’s trading volume jumps to a two-week high, while the market cap also renews its ATH, which in turn suggests active participation in fueling the prices. According to Santiment’s data, BNB’s daily trading volume jumps to $3.42 billion, and the market cap reaches $120.84 billion at the press time.
Still, overbought conditions of the 14-day Relative Strength Index (RSI) and proximity to multi-month resistances could test the altcoin’s further upside.
Binance Coin Price: Daily Chart Signals Long Road for Bulls

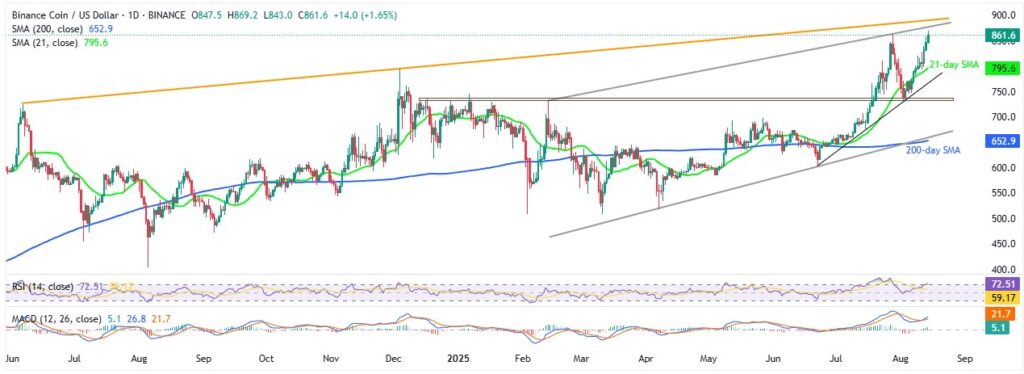
Binance Coin extends the early-August rebound from an eight-month horizontal support to hit a record high, stretching last week’s 21-day SMA breakout amid bullish MACD signals.
However, a six-month-old ascending trend channel, currently between $880.00 and $660.00, could test the BNB bulls, especially when the RSI line pierces the 70.00 overbought limit.
Should the price rise past $880.00, an ascending trend line from June 2024, close to $890.00 at the latest, quickly followed by the $900.00 round figure, might act as the final defense of the BNB bears before highlighting the $1,000 psychological magnet.
Alternatively, multiple supports around $845.00 and $815.00 could test the Binance Coin sellers before the $795.00 support confluence comprising the 21-day SMA and December 2024 peak.
Following that, the aforementioned eight-month horizontal support area surrounding $740.00-$730.00 will gain the BNB bear’s attention.
Above all, the Binance Coin’s bullish trend remains intact unless it breaks the previously stated channel’s bottom line, close to $660.00, as well as the 200-day SMA support of $652.00.
Binance Coin Price: Four-Hour Chart Highlights Immediate Hurdles

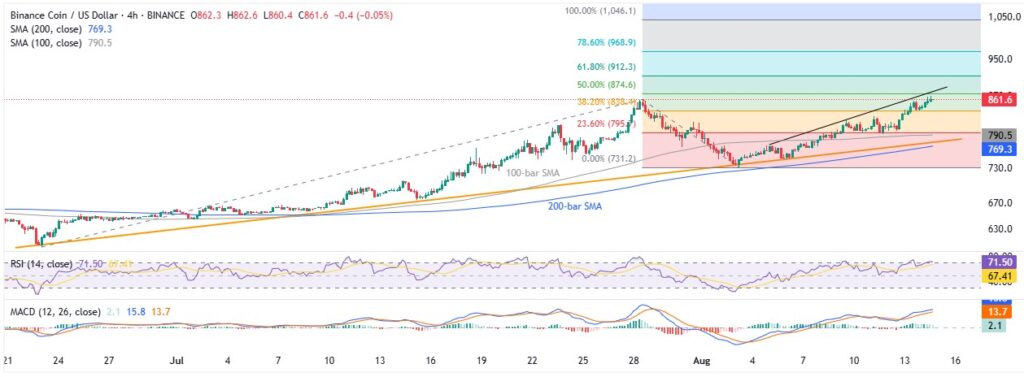
The BNB price appears closer to resistance on the four-hour chart as a week-long rising trend line, close to $878.00, guards the immediate upside of the altcoin. The adjacent resistance gains more weight from the overbought RSI line, currently around 72.00.
In a case where the quote ignores the overbought RSI and crosses the $878.00 hurdle, it needs validation from the $880.00 hurdle discussed on the daily chart before highlighting the key Fibonacci Extension (FE) levels of the BNB’s June-August moves.
Among them, 61.8% ($912.3), 78.6% ($968.9), and the 100% FE level of $1,046 appear clearly visible on the chart.
On the flip side, the 23.6% FE level of $795.00 appears as nearby support to watch during the Binance Coin’s retreat, a break of which could highlight the 100-bar SMA of $790.00.
It’s worth noting that an ascending trend line from June, close to $778.00, precedes the 200-bar SMA of $769.00 to act as a short-term key support for the BNB bears to watch.
Conclusion
Binance Coin is expected to maintain its steady upward trajectory in the long run, even as the overbought RSI conditions suggest a short-term consolidation in the BNB price.
Also read: Nasdaq-Listed BNC Becomes Largest Corporate BNB Holder With $160M Purchase


