- Binance Coin price fades recovery from 50-day SMA, falling for the second straight day.
- Downbeat oscillators, failure to hold previous rebound, highlight key SMA, six-week support trendline.
- Rising trendline from late June, multiple SMAs keep BNB buyers hopeful despite recent pullback.
- A broad bullish trend prevails as long as the Binance Coin price stays beyond the 200-day SMA.
Binance Coin (BNB) price drops over 2.0% to $1,070 early Tuesday, extending the previous day’s reversal while fading Friday’s bounce off the key support line and 50-day Simple Moving Average (SMA).
Given the crypto market’s consolidation and downbeat signals from the Moving Average Convergence Divergence (MACD) and the 14-day Relative Strength Index (RSI) momentum indicators, coupled with the BNB’s inability to defend its previous rebound, the sellers flex their muscles.
Read Details: Cryptocurrency Weekly Price Prediction: BTC, ETH & XRP Dive Deeper amid Trade War Tensions, ETF Outflows
Adding strength to the Binance Coin pullback is the downbeat market capitalization. However, a retreat in the trading volume and multiple key technical support levels could challenge the bears.
According to Santiment, the Binance Coin’s daily trading volume retreats from a three-day high to $4.01 billion, while the market cap slides to a three-week low of $148.62 billion by press time.
With this, the BNB buyers need a strong fundamental push to stall the short-term bearish bias, as well as hold the broad bullish trend.
BNB Price: Daily Chart Keeps Buyers Hopeful Beyond $1,040

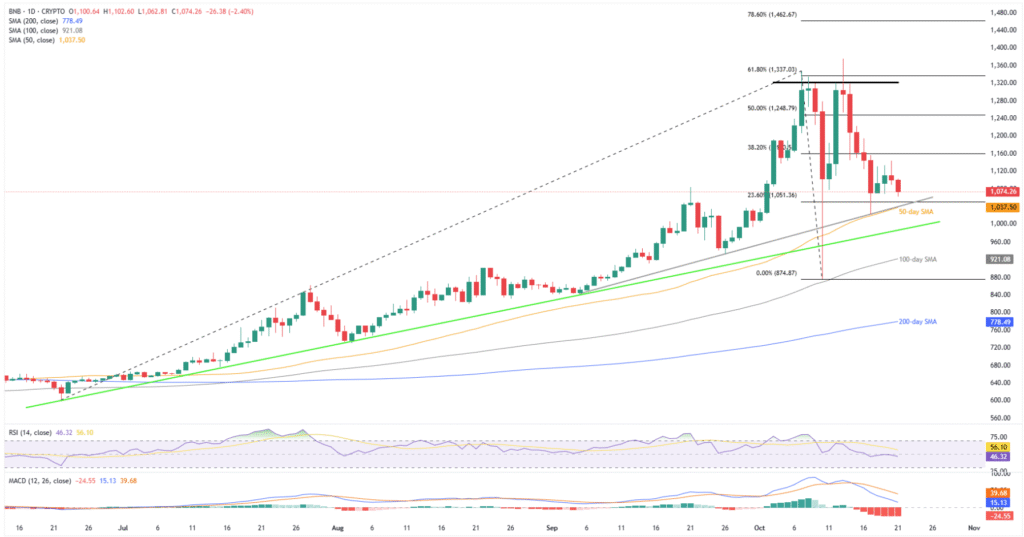
The Binance Coin’s failure to defend Friday’s recovery from the 50-day SMA and an ascending trend line from early September joins bearish MACD signals (red histograms) and an easy RSI line, near the 50.00 neutral level, to suggest a short-term weakness in the prices.
This highlights an area comprising the 50-day SMA and the six-week rising support line, close to $1,040-$1,035.
Should the BNB bears manage to smash $1,035 support, which is less likely, the $1,000 threshold and an ascending trendline from June, close to $988.00, will be crucial to watch as a downside break of the same will shift the power toward the sellers.
Even so, the 100-day and 200-day SMAs, respectively near $921.00 and $778.00, could test the BNB bears before giving them full control.
Alternatively, Binance Coin’s fresh rise could aim for the 38.2% and 50% Fibonacci Extensions (FE) of its June-October moves, respectively, near $1,160 and $1,250.
Beyond that, a two-week horizontal resistance area near $1,320-$1,330 will act as the final defense of the bears, a break of which would challenge the recent all-time high (ATH) of $1,376, highlighting the $1,400 threshold and the 76.8% FE level of $1,463.
BNB Price: Four-Hour Chart Highlights Immediate Support

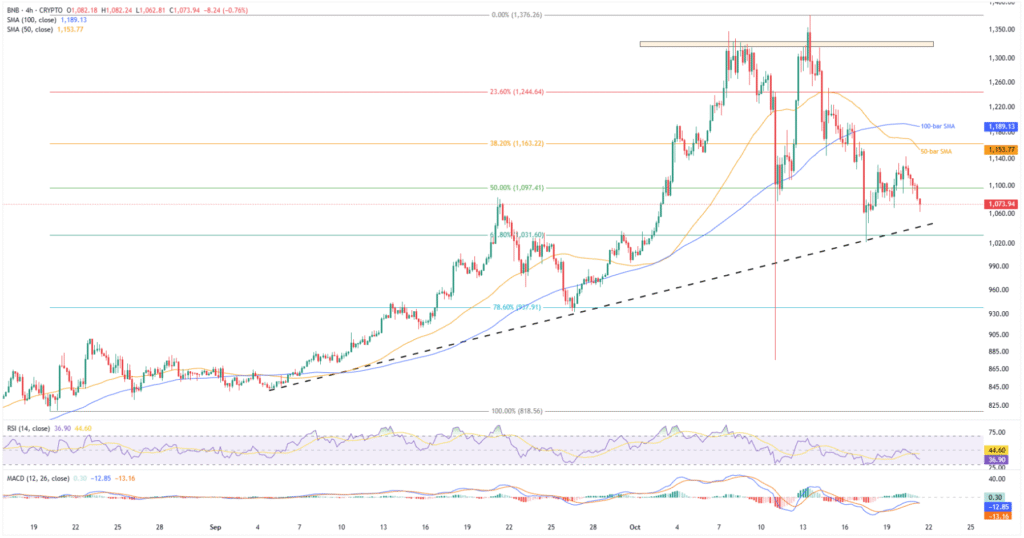
On the four-hour chart, Binance Coin fades and bounces off a six-week ascending support line, close to $1,035 by press time. The BNB pullback traces downbeat RSI and an impending bear cross on the MACD to suggest an extension toward the said support line.
Also acting as a short-term downside filter is the 61.8% Fibonacci retracement of its August-October upside, near $1,030.
Following that, the $1,000 psychological magnet and the 78.6% Fibonacci ratio of $938 may act as additional downside filters for the BNB bears to watch before targeting the daily chart’s deeper levels.
It’s worth noting that the RSI’s condition is nearly oversold, with the figures below 50.00, which in turn suggests a limited downside room.
This points to a potential rebound in the BNB prices from the $1,035 support toward the 50-bar and 100-bar SMAs, respectively, near $1,155 and $1,189.
Should Binance Coin buyers remain in the driver’s seat past $1,189, the previously mentioned two-week horizontal resistance near $1,320-$1,330, and higher levels discussed on the daily chart will be in the spotlight.
Conclusion
The Binance Coin’s (BNB) ability to grab the third-largest crypto coin status from Ripple’s XRP joins a slew of ecosystem positives and the previous recovery from the 50-day SMA to keep buyers optimistic. However, broad crypto market consolidation joins a slew of upside hurdles to test the BNB bulls, highlighting the need for strong fundamental catalysts to defend the broad bullish bias.
Also read: Coinbase to List Binance Coin, Will BNB Flip Tether Once More?


