- Binance Coin price refreshes all-time high for the third consecutive day, justifying a multi-month channel breakout.
- BNB bulls face a $1,000 test as a key psychological level coincides with an overbought RSI.
- A downside break of $910 could invalidate the bullish breakout that highlights $1,240 target.
- The Overall bull run is likely to hold despite potential intermediate pullbacks.
Binance Coin’s (BNB) price continues to smash record highs for the third consecutive day, nearing the $1,000 threshold on Thursday. Bulls ride on the momentum from the early September breakout amid crypto market optimism.
Cryptocurrency markets cheer the U.S. Federal Reserve’s (Fed) interest rate cut. Also bolstering the mood is news that the U.S. Securities and Exchange Commission (SEC) gained the required votes to ease rules for approving crypto Exchange-Traded Funds (ETFs) applications.
More updates like this could be traced to our Coin Bytes.
Meanwhile, the early-month breakout of an ascending trend channel from June 2024 and a strong trading volume, as well as upbeat market capitalization (market cap), also reinforce bullish bias about the BNB coin.
According to Santiment, Binance Coin’s daily trading volume hit a five-week high of $3.77 billion, and its market cap also posted a record high of $138.67 billion.
Still, overbought conditions of the 14-day Relative Strength Index (RSI) momentum indicator and proximity to the psychological resistances could test the altcoin’s further upside, likely offering intermediate halts during a broad rally.
Binance Coin Price: Daily Chart Signals Long Road for Bulls

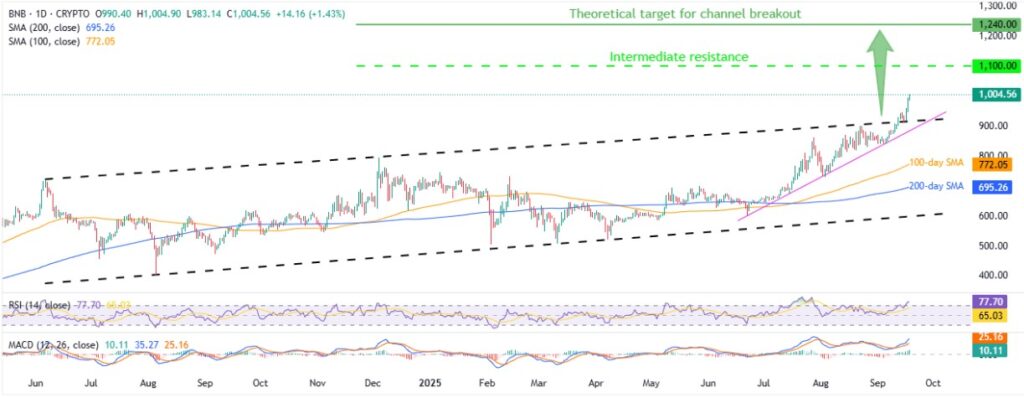
Binance Coin extends the early-September breakout of an ascending trend channel from June 2024, backed by bullish signals from the Moving Average Convergence Divergence (MACD) momentum indicator.
This breakout sets the stage for the BNB’s theoretical target for the channel breakout, around $1,240. However, the overbought RSI conditions highlight the $1,000.00 and the $1,100.00 psychological magnets as intermediate halts.
Alternatively, the aforementioned channel’s upper boundary, close to $910.00 at the latest, acts as an immediate support to watch for the BNB sellers.
Below that, a three-month rising support line near $880.00 and the previous yearly high of $793.00 may test the Binance Coin bears before directing them to the 100-day and 200-day Simple Moving Averages (SMAs), close to $771.00 and $695.00 in that order.
Notably, the BNB’s bullish outlook remains intact unless the quote stays beyond the stated multi-month channel’s bottom, currently around $595.00.
Binance Coin Price: Weekly Chart Highlights Immediate Hurdles

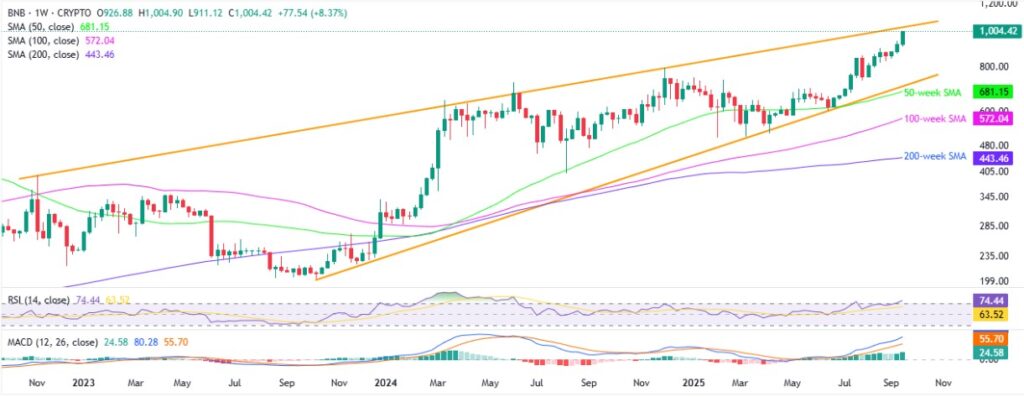
On the weekly chart, the BNB faces an immediate hurdle near $1,040 mark, comprising an ascending trend line from November 2022.
The adjacent resistance gains additional strength from the overbought RSI, even as the sustained trading beyond the key SMA and bullish MACD signals favor the buyers.
Should Binance Coin remain firmer past $1,040, its rally toward the $1,100 and the $1,240 resistances, mentioned earlier, can’t be ruled out.
Meanwhile, an ascending trend line from October 2023, near $705.00, quickly followed by the 50-week SMA of $681.00, appears to be a strong downside support for the BNB.
Below that, the 100-week and 200-week SMAs, near $571.00 and $443.00, respectively, could lure the bears.
Conclusion
The Binance Coin’s (BNB) stellar rally, up 16% in September, gained support from the technical breakout and upbeat MACD signals, not to forget the crypto market fundamentals. This could allow the BNB buyers to keep the reins and defend the overall bullish trend even if the overheated RSI hints at short-term pullbacks in prices around the $1,000 and $1,040 immediate hurdles.
Also read: Breaking News: Fed Chair Powell Cuts Interest Rate by 25 Basis Point, Bitcoin Consolidates


