- Bitcoin Cash price stalls three-day winning streak as buyers hit multi-month resistance wall.
- Seven-month resistance, nearly overbought RSI challenge BCH bulls at highest level since January.
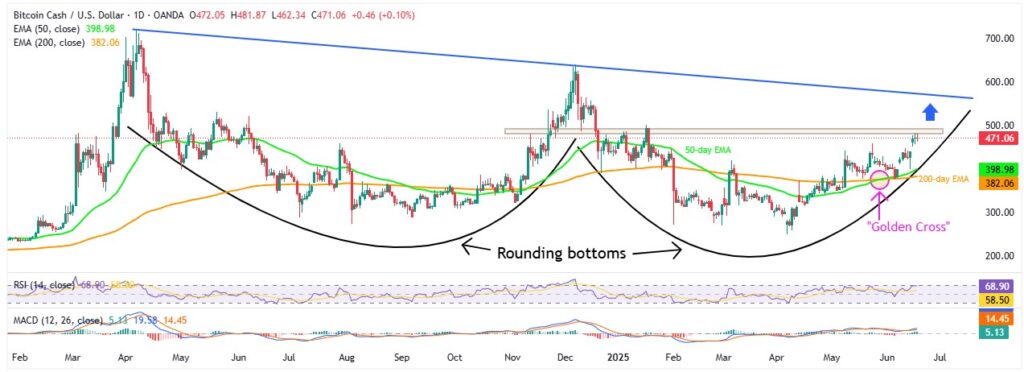
- “Golden Cross” and “Rounding Bottoms” keep BCH/USD bulls hopeful of reaching $575 hurdle.
- Channel formation, crypto market anxieties add to the upside filters.
Bitcoin Cash (BCH/USD) is slightly weaker around $470, challenging a three-day winning streak near a five-month high during Wednesday’s European session. That said, the BCH price faces resistance around a horizontal zone from mid-November 2024, while the 14-day Relative Strength Index (RSI) shows nearly overbought conditions.
Despite this, bullish signals remain strong, as evidenced by a “Golden Cross” (a bullish moving average crossover), a “Rounding Bottom” pattern on the daily chart, and positive momentum from the Moving Average Convergence Divergence (MACD) indicator, which support optimism for BCH/USD.
BCH/USD: Daily chart points to further upside

Source: Tradingview
Bitcoin Cash displays a “Golden Cross” on the daily chart, with the 50-day Exponential Moving Average (EMA) crossing above the 200-day EMA — a classic bullish signal that draws buyer attention. This signal is supported by a 14-month-old rounding bottom pattern and bullish momentum from the Moving Average Convergence Divergence (MACD) indicator.
However, the 14-day Relative Strength Index (RSI) is at 69, close to the 70 overbought threshold. This, combined with a horizontal resistance zone around $480-$490, marked since November 2024, is challenging the bulls.
Given this setup, BCH appears poised to break through the $480-$490 resistance zone and target the $500 level. That said, a sustained move above $500 could then trigger a rally toward the descending trendline from April 2024, currently near $580.
Alternatively, bearish pressure is unlikely to increase unless BCH closes daily below the converging 50-day EMA and the rounding bottom’s border, around $399 at press time. The $400 psychological level may provide short-term support, but a drop below $399 could put the 200-day EMA support at $382, the monthly low of $378, and May’s bottom at $349.00 in focus as the next major support levels.
BCH/USD: Four-hour chart signals gradual advances

Source: Tradingview
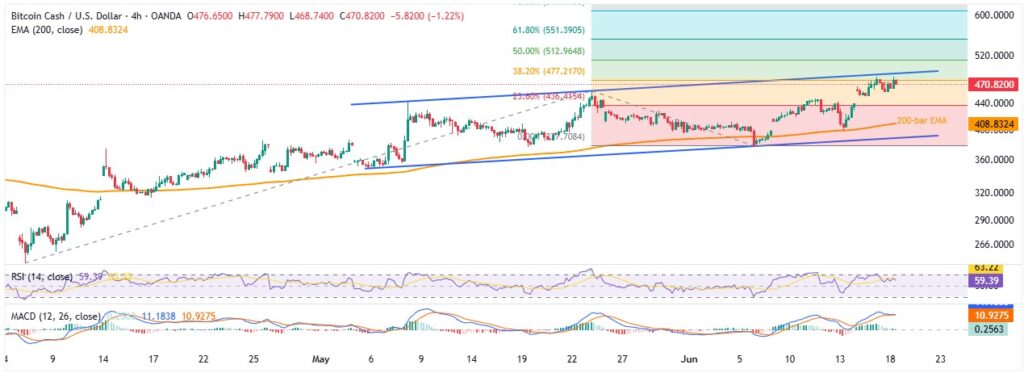
Unlike the daily chart, where BCH/USD nears key resistance that could open space beyond, the four-hour chart highlights a six-week-old bullish trend channel formation, currently between $490.00 and $388.00.
This channel, combined with sluggish MACD signals, challenges Bitcoin Cash buyers, even as sustained trading above the 200-bar EMA and strong RSI conditions suggest further upside potential.
It’s worth noting that the 23.6% Fibonacci Extension (FE) level of BCH/USD’s April–June move, near $436.00, comes before the 200-bar EMA at $408.00, both of which help limit short-term pullbacks in price.
If Bitcoin Cash drops below the $388.00 support and breaks the bullish channel, the key technical levels mentioned on the daily chart will likely draw market attention.
Overall, Bitcoin Cash appears primed for a strong upward move, though short-term pullbacks remain possible.


