- Bitcoin Cash hits fresh six-month high as bullish chart patterns align with crypto market optimism.
- “Golden Cross” and “Rounding Bottoms” on daily chart, Inverse “Head-and-Shoulders” on four-hour timeframe lure BCH bulls.
- Absence of overbought RSI, bullish MACD signals boost upside toward multi-month-old resistance.
Bitcoin Cash (BCH/USD) climbs to its highest level since January, extending a three-day winning streak to trade near $495 as of Thursday’s U.S. session. The rally is supported by classic bullish chart patterns, moving average crossovers, and strong momentum, attracting buyers toward a key multi-month resistance.
BCH/USD: Daily Chart Signals Further Advances

Source: Tradingview
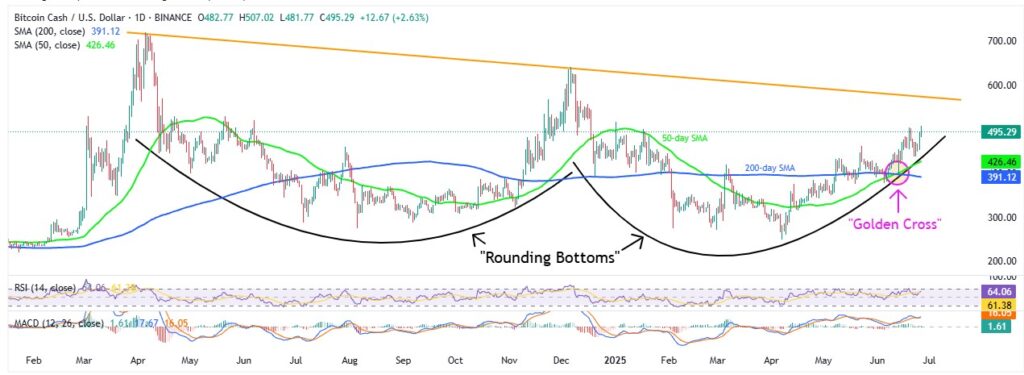
Bitcoin Cash confirms its mid-June “Golden Cross” on the daily chart, where the 50-day Simple Moving Average (SMA) crossed above the 200-day SMA — a classic bullish signal that’s drawing buyers in.
The setup is further backed by a 14-month rounding bottom, bullish Moving Average Convergence Divergence (MACD), and a non-overbought 14-day Relative Strength Index (RSI), supporting a potential climb toward the yearly high of $516.70 set on January 1.
However, a descending trendline from April near $575 may challenge bulls, especially as the RSI approaches overbought levels. A clear break above $575 could open the door toward $600 and even the late 2024 peak at $641.
On the downside, May’s high near $461 is immediate support. Further pullbacks may test $426, where the 50-day SMA aligns with the base of the rounding bottom, followed by the 200-day SMA at $391 as key support.
BCH/USD: Four-Hour Chart Portrays Inverse H&S

Source: Tradingview
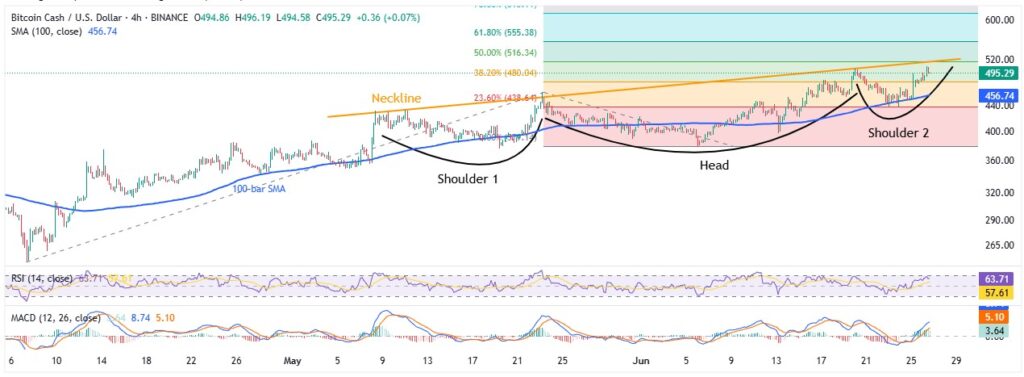
Unlike the daily chart, where BCH/USD has more room to rise, the four-hour chart shows an “Inverse Head-and-Shoulders (H&S)” pattern that needs a breakout above $517.00 to confirm further upside.
If confirmed, Bitcoin Cash could target $556.00 (61.8% Fibonacci Extension (FE) of the April–June move), then the $600.00 mark, before aiming for the pattern’s projected target near $642.00. A sustained move above $642.00 would shift focus back to higher daily chart levels.
Alternatively, the 100-bar Simple Moving Average (SMA) at $456.00 acts as immediate support. A break below it could expose the monthly low at $378.00 and deeper daily support zones.
Overall, Bitcoin Cash stays in bullish focus and looks ready to challenge its yearly high, though the four-hour chart signals a steady, rather than explosive, climb.


