- Bitcoin trades sideways in a week-long range but builds fresh bullish momentum.
- Improving RSI, MACD, and support above SMAs signal BTC’s breakout past seven-week resistance.
- 50-day and 200-bar SMAs limit BTC/USD downside within tight trading range.
- Upside break of $111K highlights the key $113,600 hurdle, the gateway to $140K.
Bitcoin (BTC/USD) holds a mild bid near $109,100 during Wednesday’s U.S. session, trading within a narrow, week-long range.
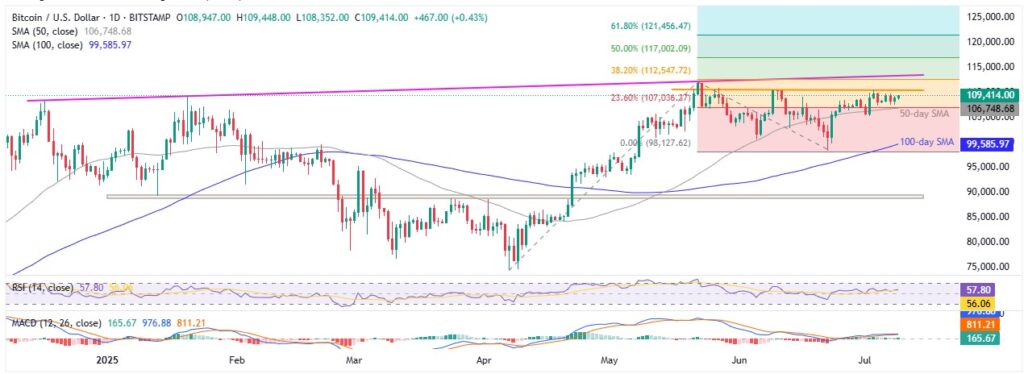
With this, the BTC price remains stuck between the 50-day Simple Moving Average (SMA) and a seven-week-old resistance line.
Still, gradually improving signals from the 14-day Relative Strength Index (RSI) and Moving Average Convergence Divergence (MACD) keep buyers optimistic about an upside breakout, paving the way to test the key resistance blocking BTC/USD from the highly anticipated $140K target.
BTC/USD: Bulls gather strength per daily chart

Source: TradingView
Bitcoin’s immediate moves face resistance from the 50-day SMA and a horizontal line drawn from late May. However, the 14-day RSI gradually climbing above the neutral 50 level, combined with bullish signals from the MACD, to keep buyers optimistic about breaking above the $111K hurdle.
If BTC clears $111K, buyers will target an upward-sloping resistance from December 2024 near $113,600. Breaking this could trigger a rally toward the much-discussed $140K mark. Along the way, the 50% and 61.8% Fibonacci Extension (FE) levels of the April–June move—around $117K and $122K—may act as key test points.
Alternatively, support lies between $106,700 and $106,740, where the 50-day SMA meets the 23.6% FE. Additional downside protection comes from the monthly low at $105,130, the early-June swing low near $100,426, the previous monthly low of $98,240, and the 100-day SMA around $99,582.
BTC/USD: Four-Hour chart depicts upside momentum

Source: TradingView
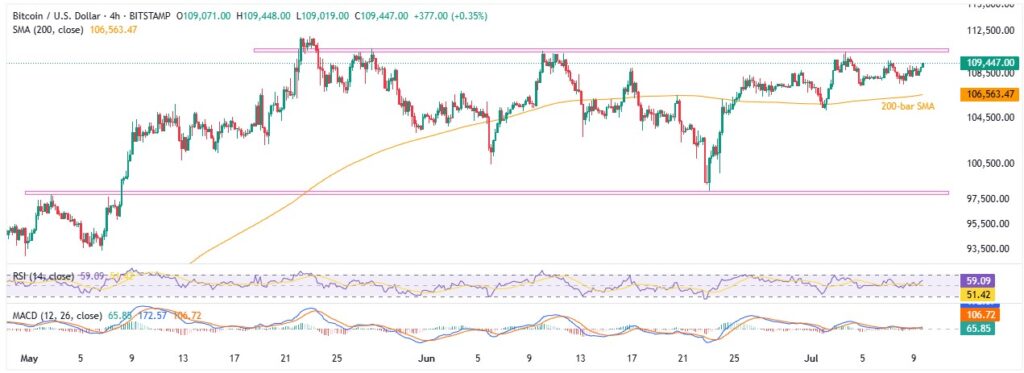
Similar to the daily setup, Bitcoin’s four-hour chart shows short-term consolidation, with price trapped between the 200-bar SMA at $106,560 and a seven-week resistance zone at $110,600–$110,800. The RSI mirrors the gradual upward trend seen on the daily chart, but the MACD remains sluggish, hinting at a slow, steady grind to the north.
Beyond that, May’s peak at $112K adds another upside barrier for BTC/USD bulls, complementing the resistance levels discussed in the daily chart.
On the flip side, a break below the 200-bar SMA support at $106,560 would shift focus to a two-month-old horizontal support zone at $98,250–$97,900. That said, key daily chart levels may provide temporary support if the decline deepens below $106,560.
All in all, Bitcoin buyers appear poised for a new high, but a solid fundamental catalyst is likely needed to break this period of indecision.


