- Bitcoin price stays defensive after five-day winning streak, with buyers keeping bullish breakout after hitting an all-time high.
- Upper Bollinger Band tests BTC buyers, but strong momentum and prior breakouts signal potential for further gains.
- Convergence of multi-week resistance line, 38.2% FE challenge short-term buyers.
- Bitcoin pullback might aim for $120K, but sell-off remains unexpected as long as the price stays beyond 200-day SMA.
Bitcoin (BTC) price remains lackluster around $123,500 early Monday, as bulls take a breather after a five-day uptrend, while also keeping Sunday’s bullish breakout near the all-time high (ATH).
Apart from a clear break of the 12-week-old resistance, now support, bullish signals from the Moving Average Convergence Divergence (MACD) and Directional Movement Index (DMI) momentum indicators also underpin the BTC’s latest rally.
Bitcoin’s trading volume struggles to support the recent rally, as the market capitalization hits a record high, making the key resistance around $127K crucial for the next move. That said, Bitcoin’s daily trading volume softens to $61.18 billion, whereas the market cap hits an ATH of $2.46 trillion by press time, according to Santiment.
On the same line, Bitcoin’s strong profitability calls for caution, as experts warn of a potential price correction after the impressive rally.
Also read: Bitcoin Profitability Hits 99.3%, Crypto Expert Cautions Major Correction
With this, Bitcoin looks poised to refresh its ATH, but with limited upside room and growing talks of corrections, bulls need to stay cautious and watch the moves closely.
Bitcoin Price: Daily chart suggests limited upside room

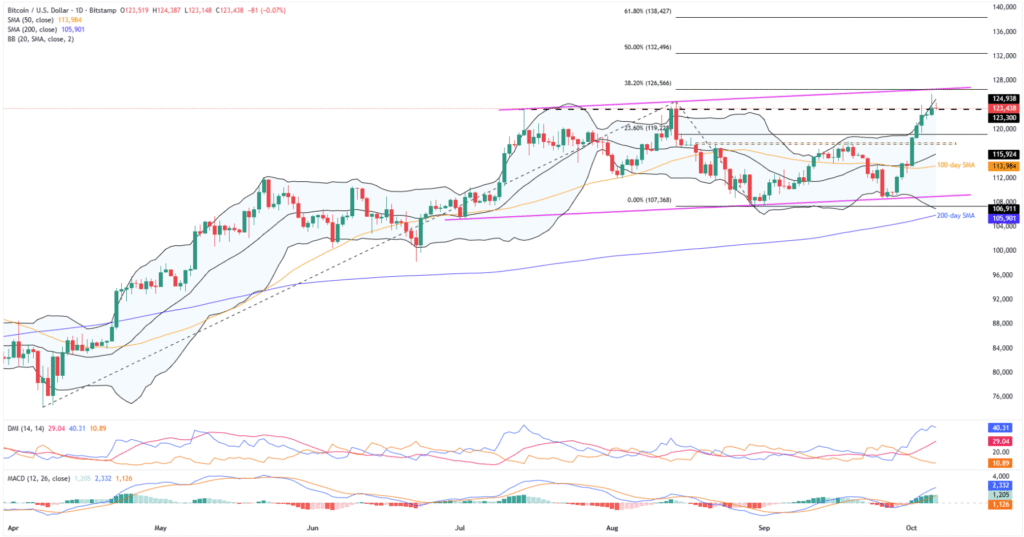
Bitcoin’s sustained breakout of a 12-week horizontal resistance, now support near $123,300, joins bullish signals from the MACD (green histograms) and DMI momentum indicators to defend the buyers. However, proximity to the key resistance levels suggests a healthy consolidation in prices before the next rally.
That said, the DMI’s Upmove (D+, blue) line tops both the Average Directional Index (ADX, red) line and the Downmove (D-, orange) line, staying well past the neutral 25.00 level. This suggests strong upside momentum.
Adding strength to the BTC’s bullish bias is the successful rebound from an ascending support line from July 01, the lower Bollinger Band (BB), and sustained trading past the 200-day SMA.
With this, the Bitcoin buyers look poised to refresh their ATH, which in turn highlights the upper BB hurdle of $125K as an immediate resistance.
Beyond that, a convergence of an ascending trend line from mid-July and a 38.2% Fibonacci retracement of Bitcoin’s April-August moves, close to $126,600, quickly followed by the $127K threshold, will be a tough nut to crack for the buyers.
Should the quote remain firmer past $127, the $130K psychological magnet might test the upside momentum before highlighting the 50% and 61.8% FE resistances, respectively, near $132,500 and $138,500.
On the flip side, a daily close beneath a 12-week-old horizontal resistance area, now support surrounding $123,300, could drag the BTC toward the $120K round figures ahead of directing sellers to a 1.5-month-long support area near $117,500-$117,800.
If BTC drops beneath the $117,500 support, the middle BB and 100-day SMA, close to $115,950 and $114K in that order, will be crucial to watch a downside break of the same could direct the sellers toward the multi-week support line and lower BB, mentioned above, respectively near $108,950 and $106,800.
Notably, Bitcoin’s downside past $106,800 seems unlikely, but if it happens, the 200-day SMA support at $105,900 will be the last line of defense for bulls. A break below this could shift control to the sellers, threatening the broader upside trend.
Bitcoin Price: Four-Hour Chart Highlights Bullish Channel

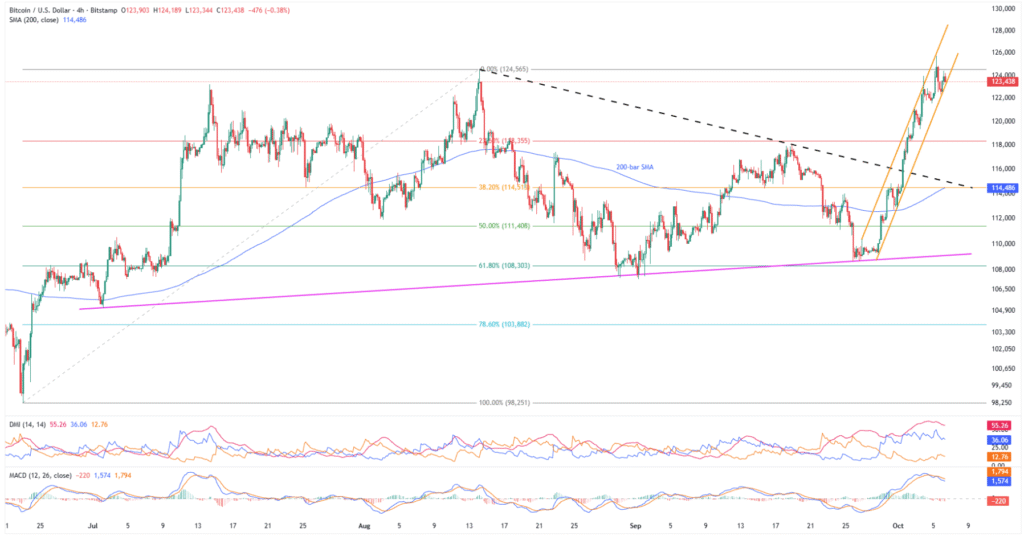
On the four-hour chart, Bitcoin’s breakout of a seven-week-old resistance line, and previous rebound from the 200-bar SMA, gains support from the bullish MACD signals (green) and upbeat DMI clues, with stronger ADX and Upmove (Blue) lines, to underpin upside bias.
Above all, a week-old ascending trend channel formation, currently between $123,300 and $126,900, defends the BTC’s bullish bias as long as the prices stay within the stated range.
On the downside break of $123,300, the $120K threshold and previous resistance line from mid-August, around $115K, will precede the 200-bar SMA support of $114,500 to lure sellers.
Below that, a four-month support line will act as the last defense of the BTC bulls around $109,100, ahead of the deeper levels discussed on the daily chart.
Meanwhile, the BTC’s upside break of $126,900 will need validation from the $127K hurdle before approaching the daily chart’s higher resistance levels.
Conclusion
Bitcoin’s recent gains have brought back key technical breakouts and bullish momentum, keeping buyers hopeful. However, the $127K resistance and growing talks of consolidation, especially with higher BTC profitability, could lead to a price pullback, though the broader bullish trend remains strong.


