- Bitcoin price remains pressured near key support confluence after repeated failed recovery attempts.
- 50-day EMA and eight-week uptrend line converge to challenge BTC bears.
- Steady RSI and bearish MACD signals hint at gradual BTC/USD downside; recovery remains elusive below $113K.
Bitcoin (BTC/USD) trades under pressure near $104,700 in Friday’s European session, fading Wednesday’s recovery following another failed bullish attempt this week.
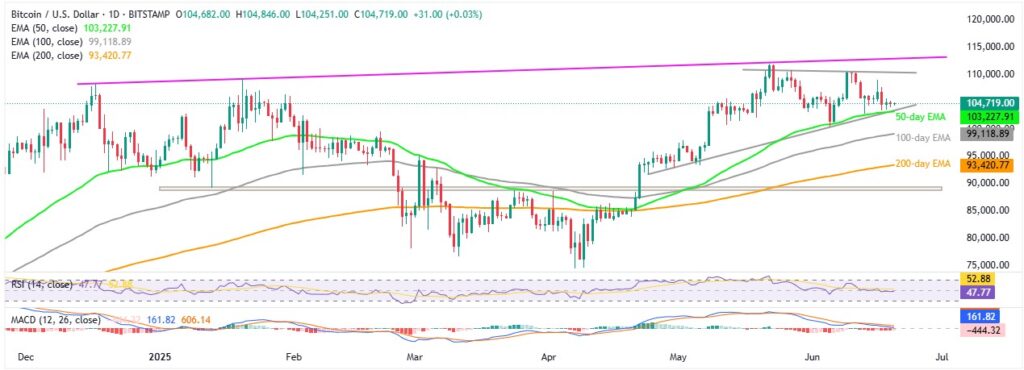
The price hovers near key support—formed by the 50-day Exponential Moving Average (EMA) and an uptrend line from April 22.
A steady 14-day Relative Strength Index (RSI) and bearish Moving Average Convergence Divergence (MACD) support a bearish bias, but a clear break below this support is needed to confirm a deeper BTC downturn.
BTC/USD: Daily chart looks alarming

Source: Tradingview
Repeated failures to hold the bounce off the 50-day EMA and a multi-day trendline, combined with steady RSI and bearish MACD signals, suggest buyers are losing strength. This could give sellers the chance to break the key $103,200 support, potentially triggering a sell-off toward the monthly low of $100,426 and then the 100-day EMA near $99,100.
If Bitcoin stays weak below $99,000, sellers may push toward the early May swing low around $97,900 and the 200-day EMA at $93,400, before testing a strong five-month horizontal support between $88,800 and $89,200.
On the upside, a rebound could reach the weekly high near $109,000, then challenge the falling resistance line from late May around $110,630. However, an upward-sloping resistance near $113,000 from late 2024 remains a tough barrier for buyers trying to regain control.
BTC/USD: Four-Hour chart hints at gradual downside

Source: Tradingview
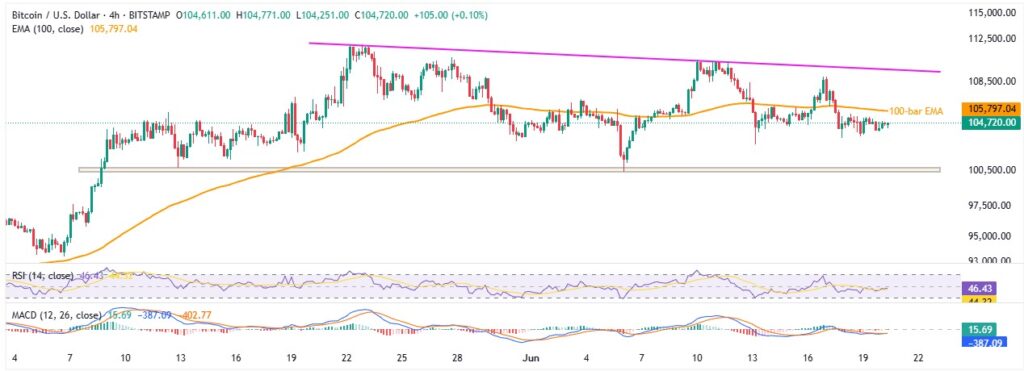
The four-hour chart shows a five-week triangle pattern, with BTC/USD trading below the 100-bar EMA. Combined with a neutral RSI line and weak MACD signals, this price action points to continued gradual weakness in Bitcoin.
The triangle, between $100,400 and $109,800, limits short-term moves, while the 100-bar EMA near $105,800 acts as immediate resistance.
Overall, Bitcoin buyers seem tired, and sellers are trying to take control—but a clear break below $103K is needed to confirm the shift.


