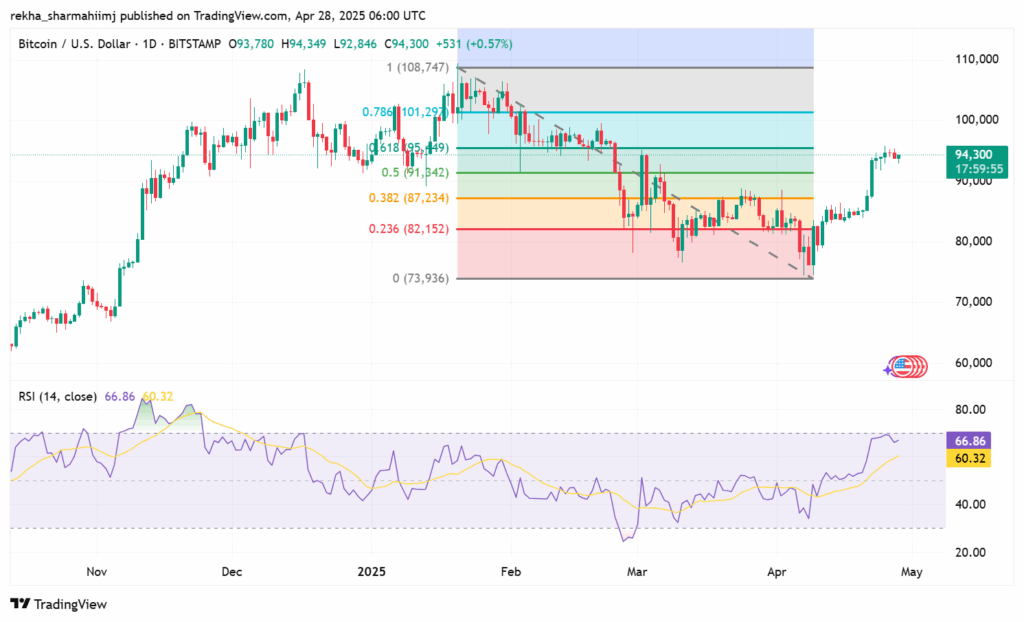
Bitcoin trades near $95k on the daily charts and lacks conviction for directional strength.
- Bitcoin (BTC) looks sideways with no clear directional strength.
- The horizontal resistance near $95 acts a hurdle for the upside momentum.
- RSI holds above 61, still away from the overbought zone.
Bitcoin (BTC) starts the fresh week on a lower note. The pioneer currency made the high of 94,349 in a sideways market with no clear directional bias. At the time of writing, BTC/USD trades at $94,257, up 0.52% for the day.
BTC/USD daily chart

On the daily chart, the BTC/USD pair trades in a tight range of $95,800-$92,000 for the past few sessions, suggesting lack of conviction among investors. After making the low of $74,588 on April 9, the pair gained 28% approx. The price struggles near the horizontal resistance placed around $95,152 that also coincides with the 0.61% Fibo. retracment level.
Thus, making it a crucial resistance zone for the bulls. To breach the level, the buyers need to exhibit strong buying conviction. A daily close above the mentioned level could potentially march toward the psychological $1,00,000 mark.
The Relative Strength Index (RSI), which measures the strength of the current trend, holds above 60. The placement suggests that there is still room for the continuation of the upside trend.
On the other hand, if the price breaks below the session’s low of $92,846, then the probability of $87,000 can not be ruled out. As on the chart, a single candle made on April 22 coerced the move from 0.38% to 0.50% Fibo. retracement level.
In nutshell, the bitcoin price is seeking new direction with a range in play between $95,000 and $92,000. A breakout above or below the mentioned levels would set the tone for the week. Traders are advised to look out for the levels before placing any directional bets.


