- Bitcoin price snaps two-day winning streak, retreats from weekly top, but bullish structure holds beyond key support.
- Upbeat RSI backs BTC’s sustained trading beyond key supports to favor bulls.
- 50-day SMA and four-month ascending trendline converge to limit short-term downside.
- BTC consolidates in the short term, but the overall bullish structure holds.
Bitcoin (BTC) price prints the first daily loss in three, so far, as sellers approach $116,900 during Friday’s European session.
The crypto major refreshed its weekly top in response to U.S. President Donald Trump’s pro-crypto action. However, the market’s consolidation, mixed sentiment, and the U.S. Dollar’s corrective bounce challenge the BTC buyers of late.
Also read: Market Digest: Bitcoin Struggles Near 116K as U.S. Tariffs Go Into Full Effect
Despite the pullback, the BTC trading volume remains firmer at a one-week high of $66.6 billion, whereas the market cap retreats to $2.32 trillion by the press time, per the Santiment data.
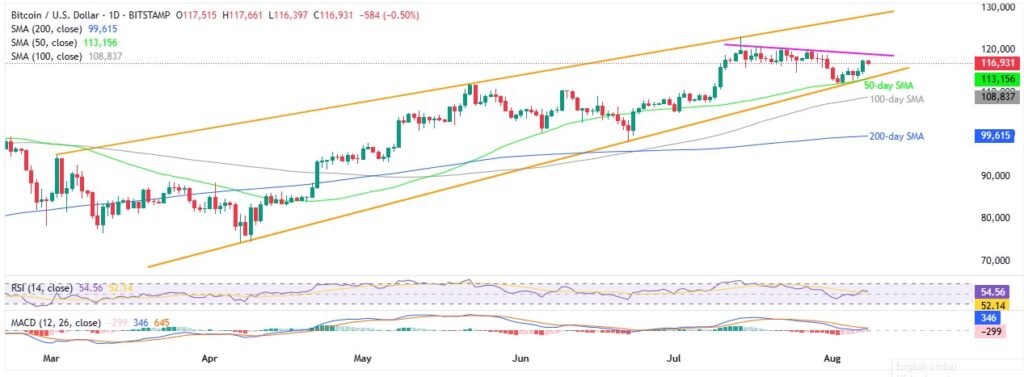
From a technical perspective, Bitcoin defends the key support levels despite the recent price retreat. This resilience joins a bullish 14-day Relative Strength Index (RSI) to keep buyer sentiment alive, even as the Moving Average Convergence Divergence (MACD) indicator flashes bearish signals.
Bitcoin Price: Daily Chart Tests Buyers

Bitcoin’s latest weakness joins the bearish MACD signals to challenge buyers after a two-day winning streak, especially when the prices remain soft beneath a three-week resistance line, close to $119K.
Still, a clear downside break of the $113K support confluence, encompassing the 50-day Simple Moving Average (SMA) and an ascending trend line from early April, becomes necessary to challenge the upside bias. Also testing the sellers is the 14-day RSI line, which is above the 50.0 neutral level, suggesting slow but gradual bullish momentum.
Even if the BTC bears manage to smash the $113K key support, the 100-day and 200-day SMAs, respectively near $108,800 and $99,600, could challenge the south-run before rejecting the overall bullish trend.
On the flip side, a daily closing beyond the immediate resistance line surrounding $119K might propel the Bitcoin price to the all-time high marked in July, around $123,230. Following that, an upward-sloping resistance line from early March, near $128K, will be in the spotlight.
Bitcoin Price: Four-Hour Chart Stays Bullish

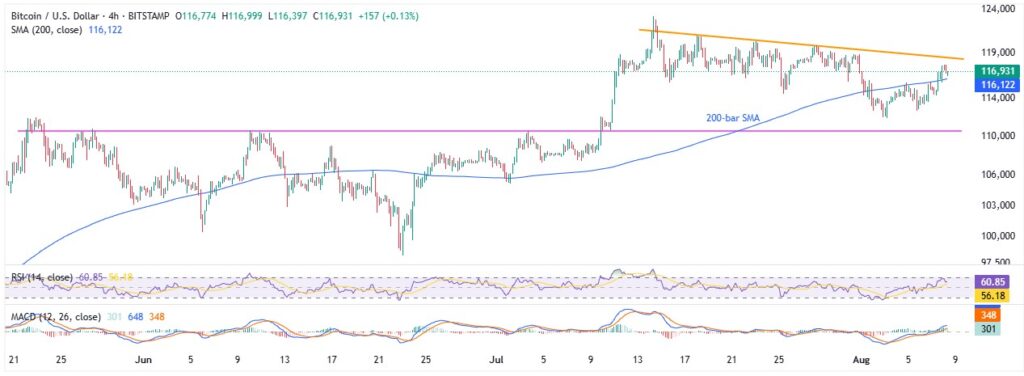
While the daily chart does not yet confirm Bitcoin’s short-term bullish bias, the four-hour chart paints a more optimistic picture. That said, the BTC is holding above the 200-bar SMA, supported by a stronger RSI and bullish MACD signals, which help buyers maintain control.
Should the quote drop beneath the 200-bar SMA support surrounding $116K, the weekly bottom of around $112, and an 11-week-old horizontal area near $110,500 could lure the BTC sellers before directing them to the daily chart levels.
Alternatively, Bitcoin’s fresh recovery needs validation from a three-week-old resistance line, near $119K by the press time. Following that, the ATH and other higher levels discussed on the daily chart could retain the market’s attention.
Conclusion
Bitcoin price lacks strong short-term bullish momentum, but its ability to sustain trading above critical support levels, particularly the $113K mark, combined with positive signals from momentum indicators like RSI and MACD, suggests that the broader uptrend remains intact.


