- Bitcoin price pulls back after refreshing all-time high, snapping two-day winning streak.
- Momentum indicators suggest steady upside, but retreat from Bollinger Band highlights $119,500 as immediate support.
- Convergence of 50-day SMA, multi-month trend line support is the key challenge for BTC bears.
- Despite a short-term pullback, Bitcoin’s broader bullish trend is likely to remain intact.
Bitcoin (BTC) price hit a fresh all-time high (ATH) above $124K before easing to $121,900 on Thursday, fuelling “Turnaround Thursday” chatter among crypto participants.
Momentum indicators like the Directional Movement Index (DMI) and Moving Average Convergence Divergence (MACD) remain positive for the BTC upside despite the latest pullback, highlighting a month-old resistance that has turned support.
Also, Bitcoin’s successful trading beyond the key Simple Moving Averages (SMAs) and multi-month trend-line supports keeps the buyers hopeful, at least beyond the crucial $115K level.
That said, the latest retreat gains support from a jump in the trading volume to a month’s high of $96.92 billion, according to Santiment, suggesting traders’ participation. The market capitalization, however, pulls back from the record top of $2.45 trillion to $2.42 trillion.
Overall, the BTC’s broader bullish trend is likely to prevail, despite a potential short-term price correction.
Bitcoin Price: Daily Chart Signals Short-Term Consolidation

After piercing the Bollinger Band’s (BB) upper boundary on the previous day, Bitcoin’s latest pullback could be linked to its failure to stay beyond.
This allows traders to book profits near the all-time high.
Still, the Directional Movement Index (DMI) defends the bullish bias with the Upmove line (Blue) staying beyond the 25.0 neutral limit, and the Average Directional Index (ADX) line (the red one) is near 21.00. On the same line, the bullish MACD signals (green) add strength to BTC’s upside bias.
Hence, the quote’s downside past $119,500 appears difficult, which, if broken, highlights a convergence of the 50-day SMA and an upward-sloping trend line support from early April, surrounding $115K.
In a case where the Bitcoin bears manage to smash the $115K support confluence, the BB’s lower boundary surrounding $111,800 and the 100-day SMA near $110,280 will be their immediate choice before confronting the 200-day SMA support of $100,084.
Following that, the BTC’s gradual downtrend towards April’s low of $74,400 can’t be ruled out.
Alternatively, July’s peak around $123,230 and the latest top near $124,500, quickly followed by the $125K round figure, could test the Bitcoin buyers during a fresh rebound.
Following that, a 6.5-month-old rising trend line highlights the $130K as the key upside hurdle for the BTC bulls to watch.
Bitcoin Price: Four-Hour Chart Highlights Bullish Channel

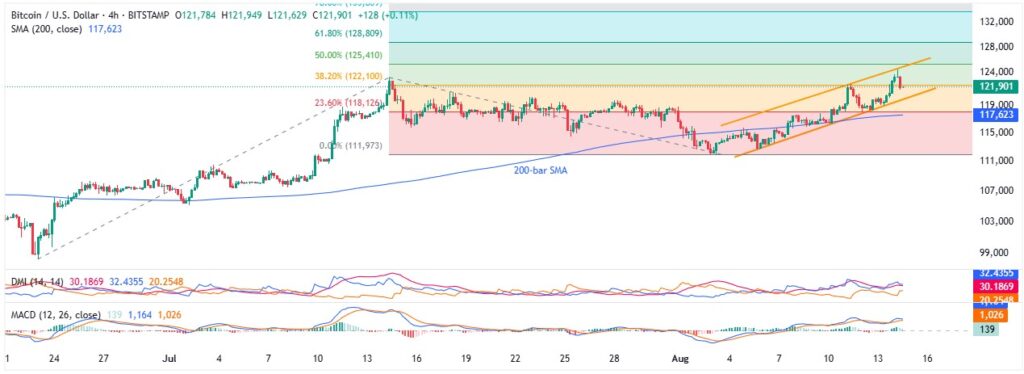
A week-long bullish trend channel, currently between $119,800 and $124,800, restricts short-term Bitcoin moves beyond the 200-bar SMA support of $117,600.
In a case where BTC remains firmer past $124,800, the 50% and 61.8% Fibonacci Extensions (FE) of the quote’s June-August moves, respectively near $125,400 and $128,800, could test the bulls before directing them to the daily chart levels.
Meanwhile, a downside break of the 200-bar SMA will need validation from the monthly low of $111,987 to convince the BTC sellers and highlight the deeper supports discussed on the daily chart.
That said, the DMI is more positive on the four-hour chart, and the MACD signals are bullish, adding strength to the hopes of witnessing a gradual upside in the BTC price.
Conclusion
Bitcoin’s latest pullback appears more like a healthy consolidation rather than a trend reversal, as it moves back within the Bollinger Bands. Meanwhile, bullish signals from DMI and MACD, along with a sustained breakout above key past resistances, continue to support the broader upward trend, keeping bulls hopeful.
Also read: Market Digest: Bitcoin Surges to 122K as Rate Cut Bets, Trade Truce Fuel Global Rally


