- Bitcoin price drops 2.0% intraday, extending pullback from key support-turned-resistance.
- Lower Bollinger Band may limit short-term BTC downside amid weak RSI.
- Multiple supports below $108K could challenge Bitcoin bears, while recovery remains unconvincing below $115,800 despite bearish MACD signals.
- Bitcoin’s short-term downside is expected to be a minor setback, with the broader bullish trend intact.
Bitcoin (BTC) price slides over 2.0% to $110,000 ahead of Friday’s New York trading session.
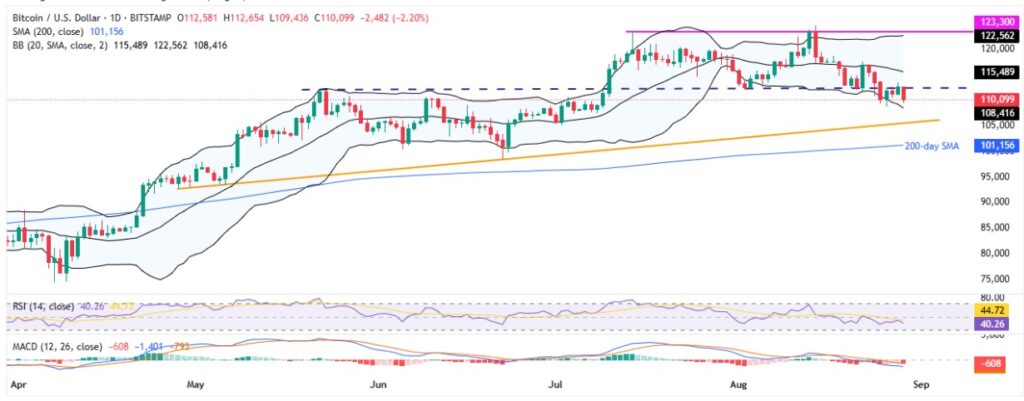
The crypto major’s latest weakness stems from its failure to provide a daily closing beyond the three-month support-turned-resistance during Thursday’s rebound. Adding strength to the downside bias are the bearish signals from the Moving Average Convergence Divergence (MACD) momentum indicator.
Also read: Tether Brings USDT to RGB, Making Bitcoin a Stablecoin Platform
An uptick in the trading volume also suggests the trader’s participation during the BTC’s fall, keeping sellers hopeful. That said, Bitcoin’s daily trading volume jumps to a three-day high of $65.05 billion, whereas the market capitalization (often referred to as the market cap) drops to a seven-week low of around $2.19 trillion, according to Sanitment.
Still, the 14-day Relative Strength Index (RSI) line, another key momentum indicator, approaches the oversold limit of 30.00, and joins a slew of downside support to raise bars for the BTC bears.
Hence, a short-term weakness in the Bitcoin price appears imminent while the long-term bullish trend is likely to hold.
Bitcoin Price: Daily Chart Tests Sellers

Failure to provide a daily closing beyond a three-month horizontal support, now resistance, joins the bearish MACD signals to favor Bitcoin sellers.
However, the RSI line’s nearness to the oversold boundary and the lower Bollinger Band (BB), close to $108,400, could limit an immediate BTC downside.
Even if the quote ignores the lower BB support, an upward-sloping trend line from late April and the 200-day Simple Moving Average (SMA), respectively near $105,500 and $101,100, will act as the final defense of the Bitcoin buyers.
On the flip side, a daily closing beyond the previous support line surrounding $112,500 could allow the BTC buyers to aim for the middle BB surrounding $115,500.
If Bitcoin holds above $115,500, bulls may aim for the $120K mark, with further hurdles at the upper Bollinger Band near $122,600 and key resistance at $123,300, clearing these could pave the way for a new all-time high (ATH), beyond the current top of $124,500.
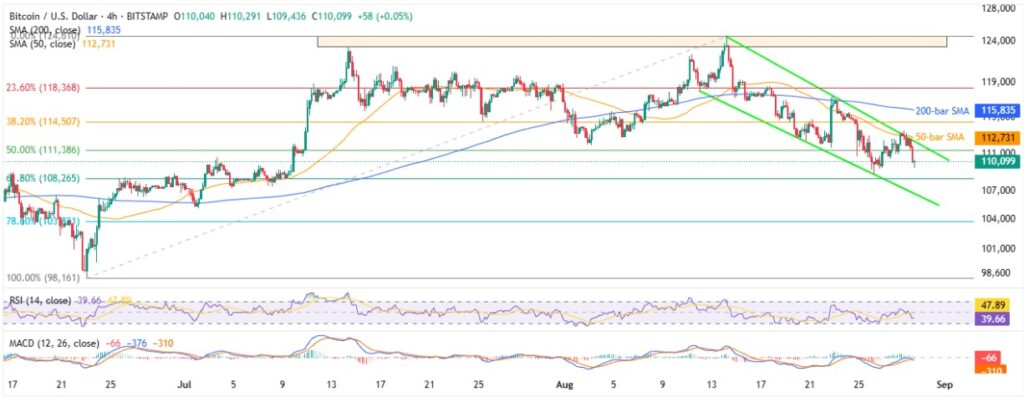
Bitcoin Price: Four-Hour Chart Points To Gradual Downside

A fortnight-old bearish trend channel joins the BTC’s sustained trading beneath the 50-bar and 200-bar SMAs to favor the sellers.
This puts the spotlight on the 61.8% Fibonacci retracement of Bitcoin’s June–August rally—known as the golden ratio, near $108,300, acting as a key short-term support.
Below that, the aforementioned bearish channel’s bottom of $106,500 could join the nearly oversold RSI to trigger a corrective bounce; if not, then the deeper levels discussed on the daily chart will be in the spotlight.
On the flip side, the 50-bar SMA joins the stated bearish channel’s top to restrict immediate BTC upside near $112,700, a break of which could highlight the 200-bar SMA hurdle of $115,800.
Above all, Bitcoin buyers should remain hopeful beyond $108K while recovery seems unconvincing below $115,800.
Conclusion
With the failure to defend $112,500 support, Bitcoin faces short-term (2-3 days) downside pressure, highlighting supports around $108K. The real test for the BTC buyers is the 200-day SMA; holding this support level of $101,100 is crucial to avoid deeper declines. Traders should watch closely for how BTC reacts around this key support.


