- Bitcoin price wavers at seven-week low, tests three-day losing streak, amid dicey markets.
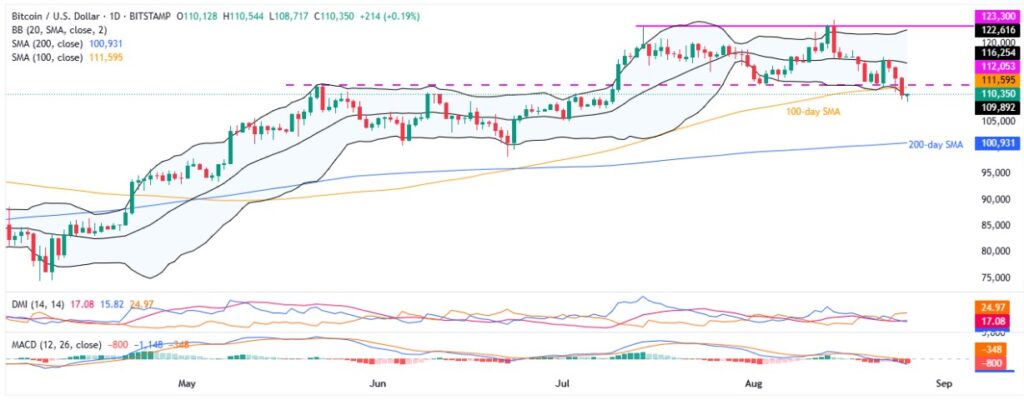
- Short-term support line and lower Bollinger Band stop BTC sellers at a multi-day low.
- Bearish MACD signals, break of three-month support keep sellers hopeful below $112K, especially with DMI showing downside momentum.
- Bitcoin’s short-term dip gains ground, but reversing the overall bullish trend hinges on a successful break of the 200-day SMA.
Bitcoin (BTC) price remains sidelined around $110,000 early Tuesday, pausing a three-day losing streak after testing its lowest level since July 09.
The crypto major’s latest rebound reflects the trader’s cautious mood amid uncertainty surrounding the U.S. Federal Reserve’s (Fed) next move, as well as mixed trade and political announcements from U.S. President Donald Trump. However, a clear downside break of the short-term key support teases the BTC sellers.
Also read: Market Digest: Bitcoin Falls to $110K as Dollar Gains and Fed Uncertainty Pressures Markets
According to Santiment, an analytical platform, Bitcoin sellers find support as daily trading volume jumps to $88.26 billion, the highest since August 14, even as the market cap fluctuates near a seven-week low around $2.19 trillion.
Further, bearish signals from the Moving Average Convergence Divergence (MACD) and the Directional Movement Index (DMI) momentum indicators reinforce the downside bias around Bitcoin, strengthening the case for continued selling pressure.
Still, a short-term support line and the lower Bollinger Band (BB) limit BTC’s immediate downside, despite a clear break of three-month support keeping bears hopeful.
A short-term decline in BTC seems likely. However, a full reversal of the broader bullish trend remains uncertain in the short-term.
Bitcoin Price: Daily Chart Tests Sellers

A clear downside break of a three-month horizontal support, now resistance, and the 100-day Simple Moving Average (SMA) joins the bearish MACD signals to favor Bitcoin sellers. However, the lower Bollinger Band (BB) restricts the quote’s immediate downside.
Notably, the DMI indicator shows the Downmove line (D–, orange) hovering near the neutral 25.00 mark, while the Average Directional Index (ADX, red) sits at 17.00, signaling a weak trend. Meanwhile, the Upmove line (D+, blue) holds near 15.00, suggesting a lack of bullish momentum.
Hence, the BTC seller’s further dominance hinges on a daily closing beneath the stated lower BB, close to $109,800 as we write.
Following that, a drop toward July’s low near $105,100 remains possible, but the 200-day SMA at $100,900 is the key for bears.
A break below the 200-day SMA could threaten BTC’s four-month recovery and expose further downside toward May’s low at $93,300, the early April high near $86,500, and April’s bottom around $74,400.
Alternatively, Bitcoin’s recovery remains elusive below the three-month support-turned-resistance surrounding $112K. Also acting as an immediate upside filter is the 100-day SMA of $111,600.
In a case where the BTC buyers manage to cross the $112K hurdle, the middle BB near $116,300 and the $120K threshold could flash on their radars before the upper BB of $122,600, a six-week horizontal resistance near $123,300, and the record high of $124,517.
Bitcoin Price: Four-Hour Chart Points To Gradual Downside

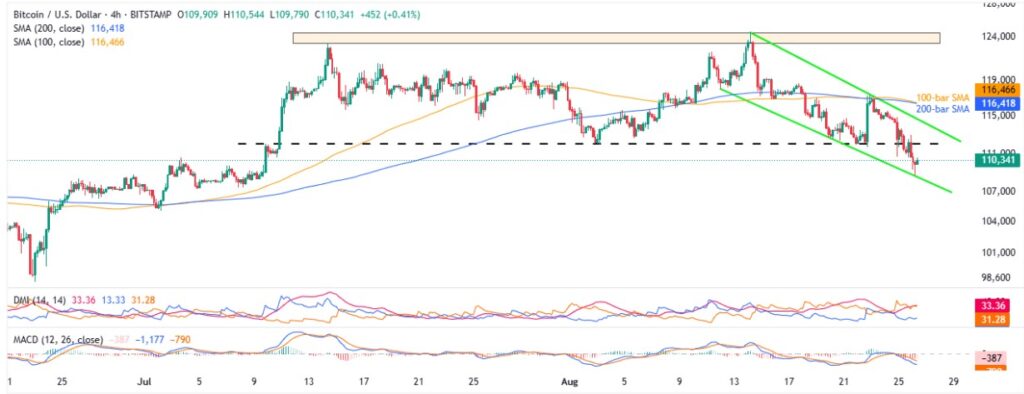
A fortnight-old bearish trend channel joins the BTC’s sustained trading beneath the 100-bar and 200-bar SMA confluence to favor the sellers.
Adding strength to the downside bias are the bearish MACD signals and the DMI indicator’s show of downside momentum. That said, the Downmove line (D–, orange) stays firmer beyond the neutral 25.00 mark, while the Average Directional Index (ADX, red) sits at 33.00, signaling a strong short-term downtrend. Meanwhile, the Upmove line (D+, blue) holds near 13.00, pointing to a lack of upside momentum.
With this, the quote is likely to stay within the short-term descending trend channel, currently between $108,500 and $115K, with the $112K acting as an intermediate resistance. That said, a convergence of the 100-bar and 200-bar SMA, close to $116,500, appears to be a tough nut to crack for the Bitcoin buyers, a break of which will allow them to aim for a broad resistance zone between $123,300 and $124,500.
Alternatively, a downside break of $108,500 support could drag the BTC price to July’s low around $105,100, before highlighting the deeper support levels mentioned on the daily chart.
Conclusion
With $112K support broken, Bitcoin faces pressure, but short-term support may limit losses. The real test now is the 200-day SMA; holding this support level of $100,900 is crucial to avoid deeper declines. Traders should watch closely how BTC reacts around this key support.
Also read: Strategy Raises $357 Million, Buys 3,081 Bitcoin, Pushing Total Holdings to 632,457 BTC


