- Bitcoin price ends a three-day rally, marking its second pullback from multi-month resistance in just a week.
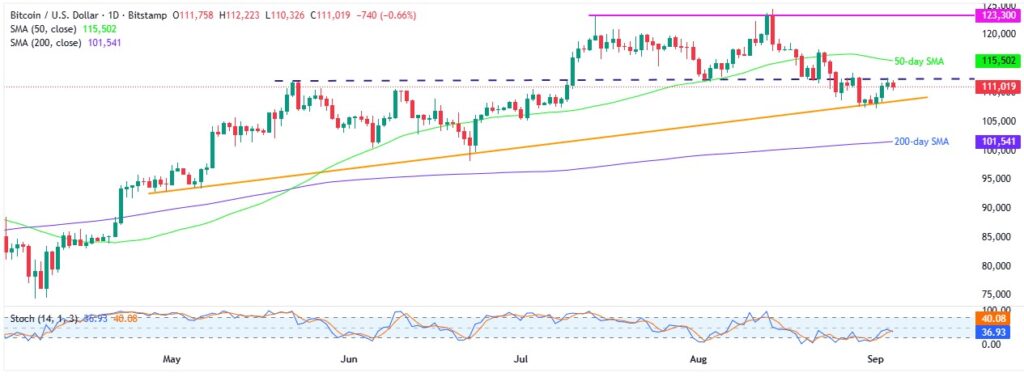
- BTC retreats from May’s horizontal resistance, fading bounce off ascending trendline support from April.
- Stochastic shows sluggish momentum, challenging the crypto major’s retreat.
- 200-day SMA acts as the final line of defense for BTC bulls, 50-day SMA offers an additional upside filter.
- Several key catalysts emerge to challenge Bitcoin’s downtrend, even in the short term.
Bitcoin (BTC) price slips to $111,000, ending a three-day rally, as momentum fades near weekly highs in a dull Thursday European session.
With his, the crypto major faces a second rejection in a week from May’s horizontal resistance, but a rising trendline from late April continues to challenge bears, especially amid weakening momentum seen in the Stochastic indicator.
In line with the Stochastic, weaker trading volume and a pullback in the market capitalization also challenge the Bitcoin sellers, even if the quote retreats from the key resistance. According to Santiment, BTC’s daily trading volume eases for the second consecutive day to $57.99 billion while the market cap retreats from a week’s high to $2.2 trillion.
Hence, Bitcoin’s recent dip highlights multi-month resistance but poses little threat to the broader bullish trend.
For more cryptocurrency news, check out our Crypto Bytes.
Bitcoin Price: Daily Chart Tests Sellers

Bitcoin’s repeated failure to close above the 3.5-month horizontal resistance at $112,500 marks it as the key hurdle to watch for upside momentum.
That said, Stochastic below the 50 neutral level signals limited backing for BTC’s recent dip, putting focus on the April 28 ascending trendline near $108K as critical support.
Should the BTC break the $108K key support, it can quickly fall to the 200-day Simple Moving Average (SMA), near $101,500, with Monday’s low of $107,270 and July’s bottom of $105,130 likely acting as intermediate halts.
In a case where the 200-day SMA also fails to stop Bitcoin bears, June’s low of $98,250 will be the last line of defense for the bulls.
Alternatively, a daily closing beyond the multi-month horizontal resistance surrounding $112,500 can trigger the BTC run-up toward the 50-day SMA hurdle of $115,500.
If Bitcoin holds above $115,500, bulls may aim for the $120K mark, with further hurdles at the $123,300 mark comprising tops since mid-July, clearing these could pave the way for a new all-time high (ATH), beyond the current peak of $124,500.
Bitcoin Price: Four-Hour Chart Points To Gradual Downside

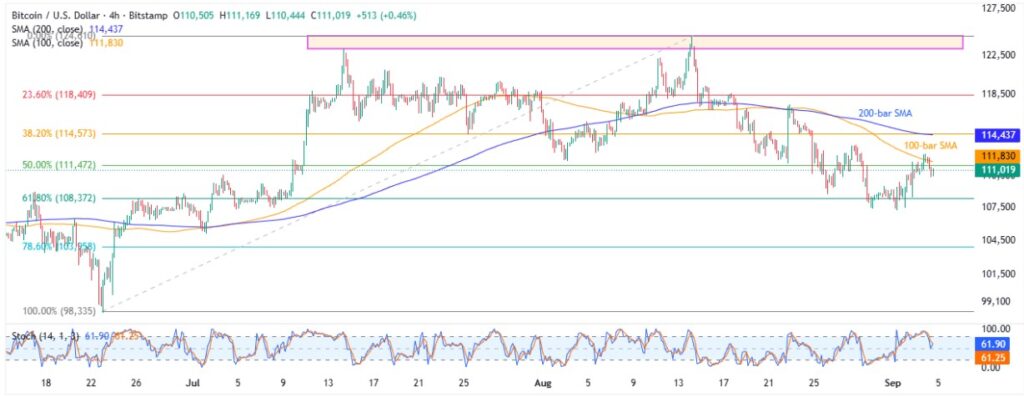
On the four-hour chart, Bitcoin fades the bounce off 61.8% Fibonacci retracement of its June-August rise, retreating from the 100-bar SMA.
With Stochastic retreating to healthy levels, the quote’s rebound from the key Fibonacci Retracement level, also known as the “golden Fibonacci Ratio, is likely to continue.
This highlights the 100-bar SMA surrounding $111,800 as the immediate upside hurdle ahead of the key $112,500 discussed on the daily chart.
Beyond that, the 200-bar SMA level of $114,400 and a seven-week horizontal resistance area surrounding $123,300-$124,500, as well as the daily chart levels, will be in the spotlight.
On the flip side, the “Golden Fibonacci Ratio” near $108,370 restricts immediate BTC downside before the multi-month support line of around $108K, discussed on the daily chart, a break of which will confirm further downside toward deeper support levels.
Conclusion
Bitcoin repeatedly retreats from key resistance near $112,500, but bounces off a multi-month ascending support line surrounding $108,000.
Still, the BTC’s recent pullback attracts the short-term sellers amid the broad market consolidation. However, the downbeat momentum and softer trading volume suggest that the bulls remain in control.
With this, Bitcoin buyers should watch for a clear break above $112,500 to expect a rally toward $120,000 and beyond. Meanwhile, a drop below $108,000 may trigger deeper corrections and can challenge the broader bullish outlook about the crypto major. Hence, the BTC traders should watch these pivotal levels for signs of the next major move.
Also read: Market Digest: Bitcoin Holds at 112K ,Gold hits ATH as China Parade Stirs Tensions With U.S


