- Bitcoin price falls to a one-week low as sellers challenge 6.5-month support, inviting fresh bearish pressure.
- BTC bearish trend needs a daily close below $117K, but SMAs and Stochastic may slow the fall.
- Fresh recovery can eye $123,500 and new ATH, but a confirmed rising wedge break may push Bitcoin toward yearly lows.
- Short-term BTC dip looks likely, but a full reversal of the yearly rally seems unexpected.
Bitcoin (BTC) slides over 2.0% intraday to $115K as sellers attack key supports during Monday’s crypto market consolidation.
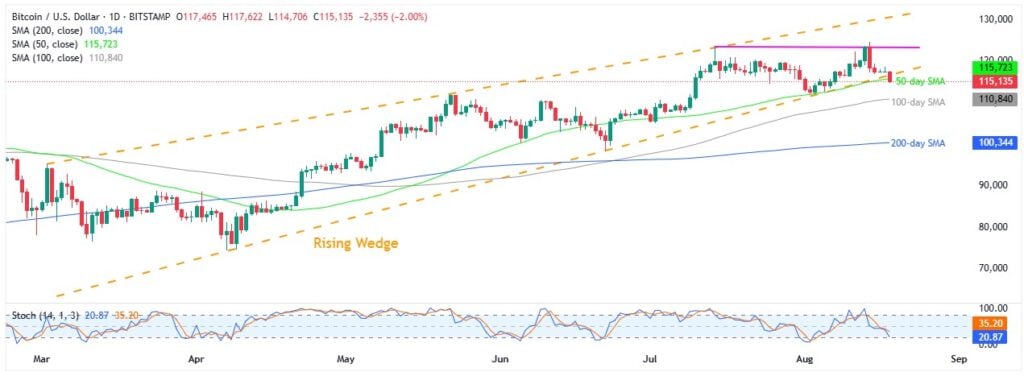
The BTC’s latest downside gains major attention due to a 6.5-month-old “Rising Wedge” bearish chart pattern. Still, a daily closing beneath the key $117K becomes necessary for the seller’s conviction. Even so, a slew of downside supports and a nearly oversold Stochastic could offer a long and bumpy road to the bears.
Bitcoin’s trading volume jumps to a three-day high and backs sellers to poke key supports, keeping them hopeful of confirming the bearish chart formation. That said, Santiment data suggests Monday’s daily trading volume for BTC is $61.23 billion and a 12-day low market capitalization of $2.29 trillion.
Bitcoin Price: Daily Chart Teases Sellers

Bitcoin’s failure to defend the all-time high (ATH) joined a downward-sloping Stochastic to direct bears toward confirming a multi-month rising wedge bearish chart formation. However, a daily closing beneath the $117K support, as well as below the 50-day Simple Moving Average (SMA) level of $115,700, becomes necessary to keep the BTC bears on the lookout.
Following that, the 100-day and 200-day SMAs, respectively near $110,800 and $100,300, and early April’s high around $88,800, could act as intermediate halts before highlighting the yearly bottom of $74,434. It’s worth noting that the rising wedge’s theoretical target is $67K.
Alternatively, Bitcon’s failure to provide a daily closing beneath the $117K could trigger a fresh recovery targeting a month-old horizontal resistance surrounding $123,300, quickly followed by the recent ATH of $124,500.
In a case where the BTC bulls keep the reins past $124,500, the stated wedge’s top line surrounding $130,700 will flash on their radars.
Bitcoin Price: Four-Hour Chart Looks Less Bearish

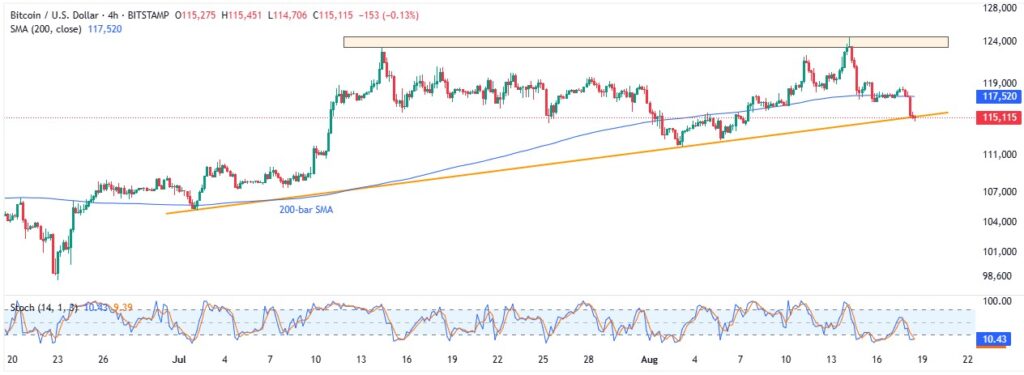
Unlike the daily chart, the BTC bears seem to be running out of gas on the four-hour chart as the Stochastic is deep beneath the oversold boundary of 20.00 and the price pokes a six-week trend line support surrounding $115,200.
Even so, any recovery needs to overcome the 200-bar SMA hurdle of $117,500 to restore Bitcoin buyers’ confidence. Following that, a month-old horizontal resistance near $122,800 and $124,500 will be the seller’s last defense, a break of which will highlight the daily chart levels.
Conclusion
Bitcoin’s uptrend faces growing pressure, but a full reversal still seems unlikely as multiple supports stand tall to challenge bears. Even so, the short-term sellers are gaining momentum and can challenge investors if the key support levels break, keeping the broader outlook clumsy in the short-term.
Also read: Market Digest: Bitcoin Holds Near $117K as U.S.–Russia Diplomacy Clouds Markets


