- Bitcoin price hits 15-week low, breaking 200-day SMA during a four-day losing streak.
- The rejection of a multi-month bullish channel, a key SMA breakdown, and bearish MACD signals keep BTC bears optimistic.
- The lower Bollinger Band can offer intraday support to Bitcoin bears before the horizontal area from May.
- BTC’s $98K breakdown can challenge the broader bullish trend; any recovery remains elusive below the 100-day SMA.
Bitcoin (BTC) extends a four-day losing streak, testing early July lows, and is down over 1.0% to $105,700 as of Friday morning.
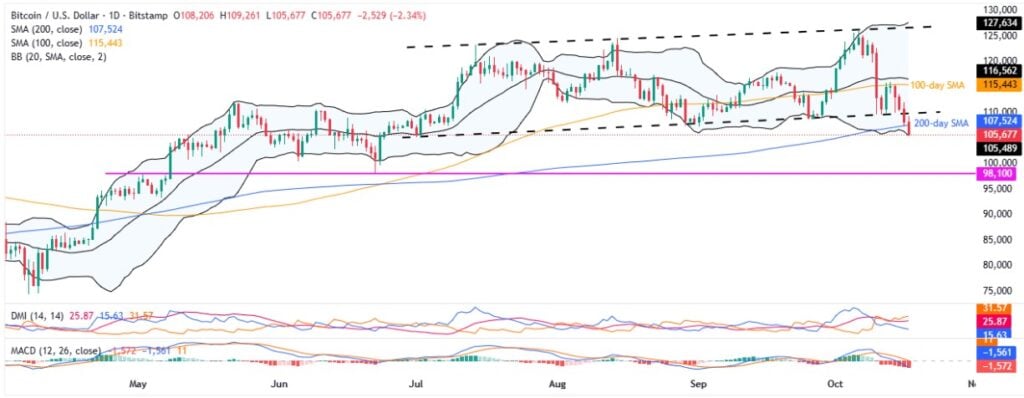
With this, the crypto major slides beneath the 200-day Simple Moving Average (SMA) for the first time since late March, extending the previous day’s rejection of a 3.5-month-old bullish trend channel.
The BTC’s breakdowns also gain support from the Moving Average Convergence Divergence (MACD) and the Directional Movement Index (DMI) momentum indicators’ downbeat clues.
Along with that, strong trading volume and downbeat market capitalization (market cap) also strengthen the downside bias. According to Santiment, Bitcoin’s daily trading volume hits a three-day high of $91.83 billion, while the market cap slides to the lowest level since July 01, close to $2.11 trillion by press time.
With this, the BTC bears look poised to approach a multi-month horizontal support during their further dominance, a break of which could put the broader bullish trend at risk.
Bitcoin Price: Daily Chart Lures Bears

Bitcoin’s early-week reversal from the 100-day SMA defied an ascending trend channel since July 01 to convince sellers the previous day. Adding strength to the downside bias is the latest break beneath the 200-day SMA, for the first time since late March.
Meanwhile, an increasing strength of the bearish MACD signals (rising red histograms) and top position of the DMI’s Downmove (D-, Orange) line also suggest the crypto major’s extended south-run.
It’s worth noting that the D- line is way past the 25.00 neutral level, suggesting strong downside momentum, while the Average Directional Index (ADX, red) line is just beneath the orange line and beyond the Upmove (D+, blue) line, pointing towards very weak upside bias.
However, the lower Bollinger Band (BB), currently around $105,500, can offer a breathing space to the BTC sellers before directing them to lows marked during early June and May, close to the $100K threshold.
Notably, a 5.5-month-old horizontal support near $98,000 will be crucial for Bitcoin sellers to watch as a clear break beneath the same could challenge the crypto major’s broad bullish trend by initially highlighting $91,000, $88,000, and April’s low near $74,400 support levels.
On the contrary, the 200-day SMA and the aforementioned bullish channel’s bottom, respectively near $107,500 and $110K, may guard short-term Bitcoin recovery.
Beyond that, the 100-day SMA of $115,450 and the middle BB of $116,600 could test the BTC buyers before welcoming them with open hands.
In that case, the quote’s successive rally toward September’s high, surrounding $118K can’t be ruled out. However, the bullish channel’s top and the upper BB, close to $126,800 and $127,600, will be tough nuts to crack for Bitcoin buyers past $118K.
Bitcoin Price: Four-Hour Chart Highlights “Death Cross”

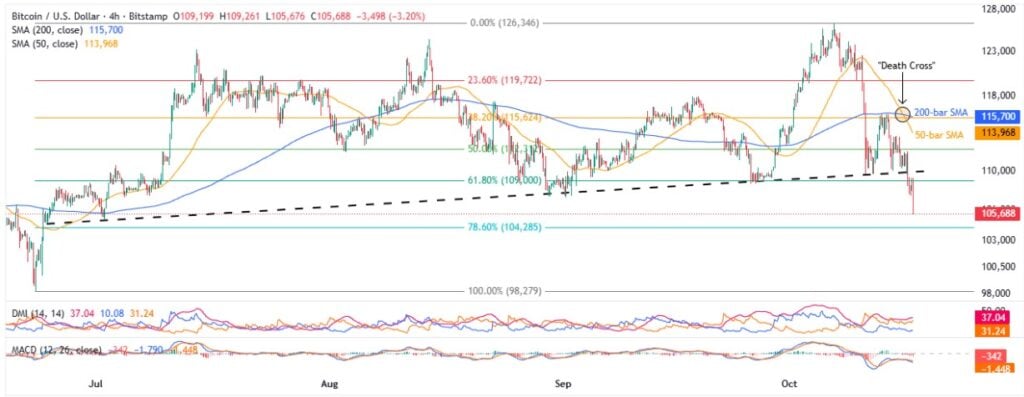
On the four-hour chart, Bitcoin price flashed a bearish signal as the 50-bar SMA crossed the 200-bar SMA from above, marking the theoretical “Death Cross”, suggesting further south-run.
The same joins the BTC’s downside break of a four-month ascending support line, now resistance near $110K, to keep sellers optimistic of visiting the 78.6% Fibonacci retracement of June-October upside, near $104,285.
Following that, the late June swing low of $98,280 and deeper levels discussed on the daily chart will be in the spotlight.
On the contrary, a corrective bounce in the BTC price will remain elusive as long as it stays beneath the support-turned-resistance line surrounding $110K.
Should Bitcoin jump back beyond $110K, the 50% Fibonacci retracement level near $112,300 and the 50-bar SMA near $114K could entertain the optimists.
However, the 200-bar SMA of $115,700 and higher levels from the daily chart could challenge the crypto major’s upside afterward.
Conclusion
Bitcoin’s rejection of the bullish channel and a downside break of the 200-day SMA join bearish momentum indicators to keep sellers hopeful. However, the crypto major’s latest fall is best considered healthy consolidation as long as the price stays beyond $98K.
Also read: Crypto Morning News: Bitcoin Falls to 108K, Gold Rises to 4300, as Bank Fears Clash with U.S.–China Tensions


