- Bitcoin price cools off from a seven-week-high, stalling a two-day winning streak amid the market’s consolidation.
- Bullish MACD and strong DMI signals back BTC’s breakout of 100-day SMA and six-week resistance, keeping buyers in control.
- Bitcoin pulls back from the upper Bollinger Band but stays supported by SMA breakouts and key support levels.
- BTC’s breakout of its six-week trading range is likely to reinforce the broad bullish trend.
Bitcoin (BTC) dips from a seven-week high to $120,200 early Friday, as bulls pause after a strong two-day rally.
The BTC’s stellar jump on Wednesday and Thursday could be linked to its upside break of a six-week-old horizontal resistance area, and bullish signals from the Moving Average Convergence Divergence (MACD) and Directional Movement Index (DMI) momentum indicators. Notably, this comes despite the U.S. government shutdown dampening recent crypto market optimism, with a corrective bounce in the U.S. Dollar.
Also read: U.S. Government Shuts Down: Political Gridlock Halts Federal Operations
Notably, the trading volume retreats after hitting a five-week high, while the market capitalization (market cap) also cools off from its highest level since mid-August, citing traders’ optimism despite mixed sentiment, which in turn can favor BTC bulls. That said, Bitcoin’s daily trading volume softens to $65.74 billion, whereas the market cap retreats from $2.40 trillion to $2.39 trillion by press time, according to Santiment.
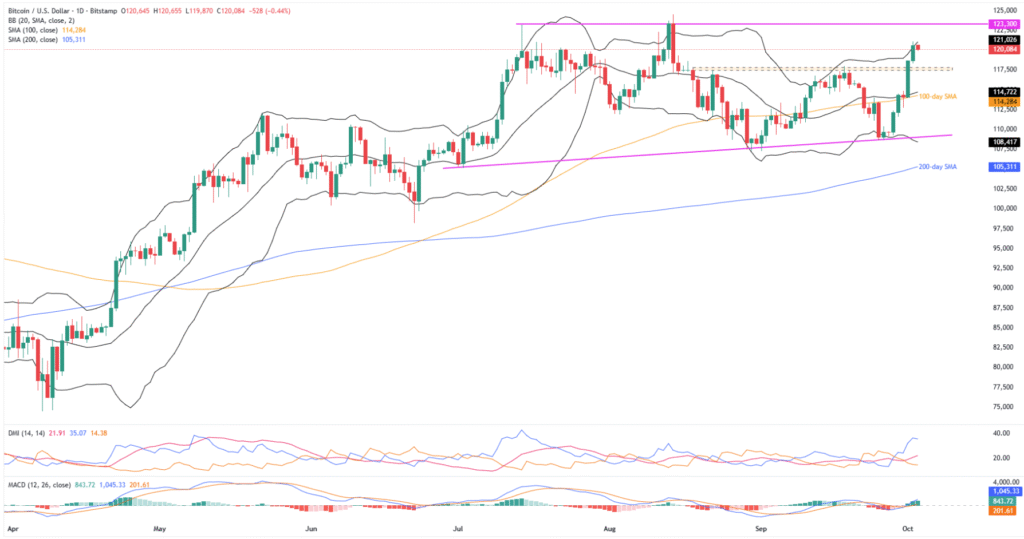
Meanwhile, Bitcoin’s early-week breakout of the 100-day Simple Moving Average, ongoing recovery from a three-month support level, and successful trading above the 200-day SMA keep buyers optimistic, even if the upper Bollinger Band (BB) tests intraday bulls. Read details!
Bitcoin Price: Daily Chart Suggests Further Upside

Despite the latest inaction, Bitcoin defends the early-week breakout of a six-week-old horizontal resistance area and the 100-day SMA, backed by a bullish MACD signal (green) and upbeat DMI clues.
That said, the DMI’s Upmove (D+, blue) line tops both the Downmove (D-, orange) line and the Average Directional Index (ADX, red) line, staying well past the neutral 25.00 level. This suggests increasing upside momentum, even if the price remains lackluster of late.
Adding strength to the BTC’s bullish bias is the successful rebound from an ascending support line from July, the lower Bollinger Band (BB), and sustained trading past the 200-day SMA.
With this, the Bitcoin buyers appear to be set to approach a 2.5-month-old horizontal resistance near $123,300.
Beyond that, the all-time high around $124,500, and the $130K psychological magnet could flash on the bull’s radar.
On the flip side, a daily close beneath a six-week-old horizontal resistance area, now support surrounding $117,500-$117,800, could trigger a short-term pullback in the BTC prices.
In that case, the 100-day SMA support of $114,280 will be the key, as a break of which could direct the BTC sellers toward the multi-week support line and lower BB, mentioned above, respectively near $109,100 and $108,400.
It’s worth noting that Bitcoin’s downside past $108,400 seems unlikely, but if it happens, the 200-day SMA support at $105,300 will be the last line of defense for bulls. A break below this could shift control to the sellers, threatening the broader upside trend.
Bitcoin Price: Four-Hour Chart Suggests Short-Term Consolidation

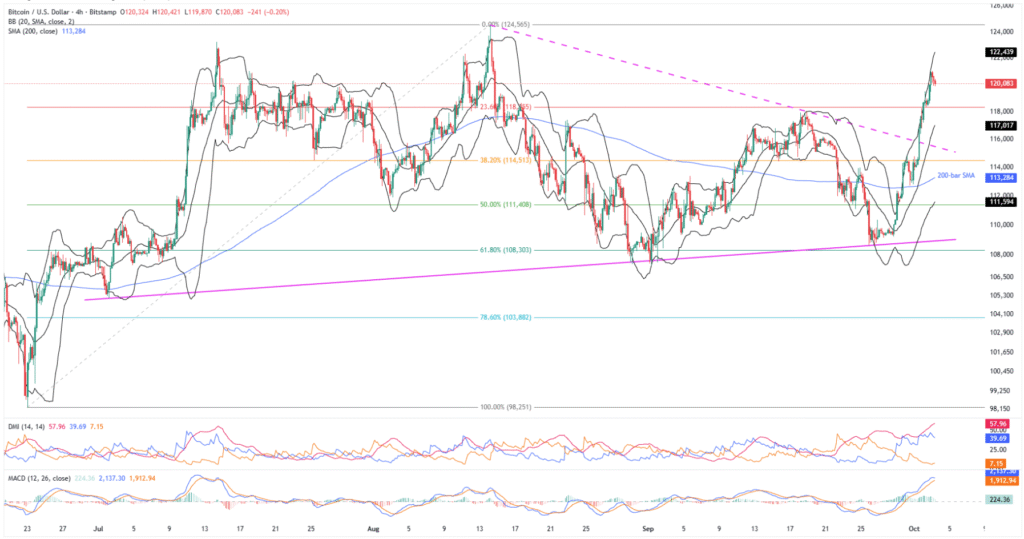
On the four-hour chart, Bitcoin’s breakout of a seven-week-old resistance line, and an early-week rebound from the 200-bar SMA, gains support from the bullish MACD signals (green) and upbeat DMI clues, with stronger ADX and Upmove (Blue) lines, to underpin upside bias.
However, the upper BB hurdle of $122,440 guards immediate BTC upside before highlighting the daily chart’s higher levels.
Alternatively, a downside break of the middle BB of $117K and the aforementioned resistance-turned-support line surrounding $115,500 could drag Bitcoin to the 200-bar SMA support of $113,280.
Below that, the lower BB of $111,600 and the multi-week rising trend line near $109,100 could lure the BTC sellers ahead of the deeper levels discussed on the daily chart.
Conclusion
Bitcoin’s recent gains justify key technical resistance breakouts and bullish momentum signals, keeping buyers optimistic, despite the latest retreat in prices. However, the upper Bollinger Band and the U.S. government shutdown could offer an intermediate halt during the crypto bull’s push toward a new record high.
Also read: Crypto Weekly Price Prediction: BTC, ETH & XRP all Tumble as U.S. Data Fuels Dollar, NFP Eyed


