- Bitcoin price snaps three-day winning streak, reversing from support-turned-resistance.
- Sustained rejection of bullish chart pattern and bearish momentum indicators lure BTC sellers.
- Lower BB, multi-month horizontal support lures short-term Bitcoin sellers.
- BTC must fall below $98K to test the broader uptrend; corrective recovery remains capped under middle BB.
Bitcoin (BTC) posts the first daily loss in four, falling over 2.0% intraday to $107,700 early Tuesday. In doing so, the crypto major reverses from a multi-month support-turned-resistance amid broad crypto market consolidation.
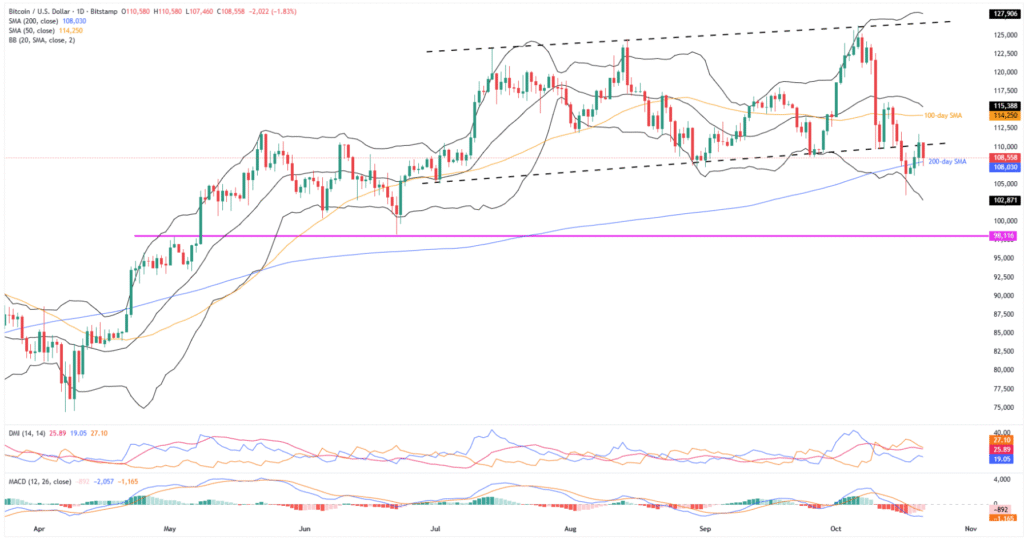
Adding strength to the BTC bearish bias are the bearish Moving Average Convergence Divergence (MACD) signals and top position of the Directional Moving Indicator’s (DMI’s) Downmove (D-, Orange) line.
It’s worth noting, however, a pullback in the daily trading volume and the market capitalization (market cap) highlights the nearby key supports to reverse the broad bullish trend. According to Santiment, BTC’s daily trading volume retreats to $62.48 billion while the market cap also eases to $2.15 trillion by press time.
That said, Bitcoin’s recent downside is still in its nascent stage to raise challenge for the broad bullish trend.
Bitcoin Price: Daily Chart Suggests Limited Downside Room

Bitcoin’s failure to keep recovery from the 200-day Simple Moving Average (SMA) and the lower Bollinger Band (BB) joins a U-turn from the 16-week bullish channel’s bottom to lure short-term sellers.
Adding strength to the downside bias is the bearish MACD signals (rising red histograms) and DMI clues to defend BTC sellers. Additionally, firmer U.S. Dollar, as the prices retreat, also suggests short-term downside in prices.
That said, the DMI’s Downmove (D-, orange) line tops the ADX line (red) and the Upmove (D+, blue) line and suggests a short-term downside in prices. The Downmove line also remains well past the neutral 25.00 level to portray the strength of the downside momentum.
With this, the BTC looks poised to drop toward the lower Bollinger Band surrounding $102,700 and then to the $100K threshold.
However, a horizontal support area from early May, close to $98K, will be a tough nut to crack for the BTC bears, a break of which will threaten the broad bullish trend.
On the upside, the aforementioned bullish channel’s bottom surrounding $110K guards the immediate BTC recovery.
Beyond that, the 100-day SMA and the mid-BB, respectively near $114,230 and $115,350, could test the buyers before giving control back to them.
Should the BTC buyers keep reins past $115,350, September’s high near $118K, and the $120K threshold could test the bulls ahead of the rising trend line from July, close to $126,800, is the key hurdle for the bulls to cross, along with the upper BB of $127,970, before targeting the $130K threshold.
Bitcoin Price: Four-Hour Chart Portrays Downside Bias

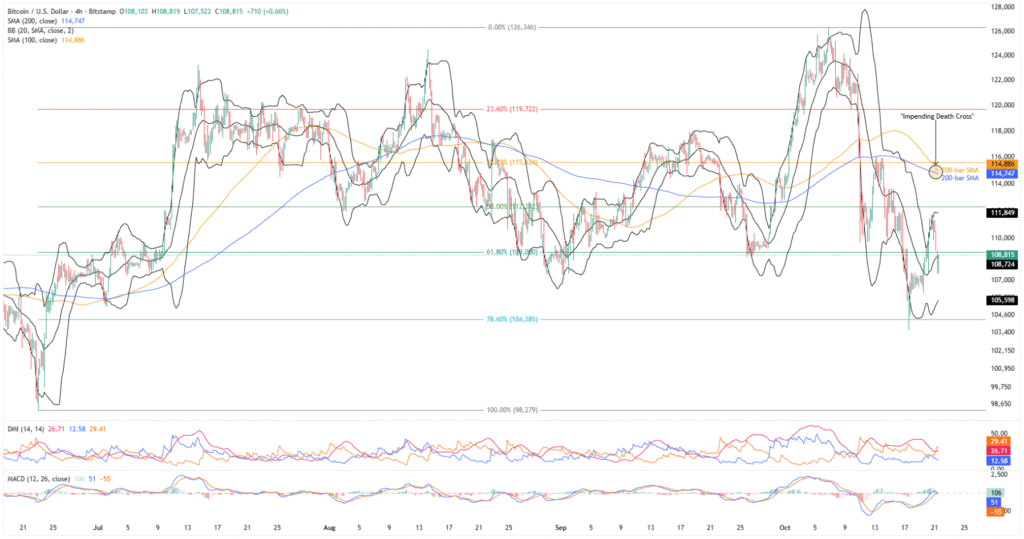
On the four-hour chart, the early-week rejection from the upper BB joins downbeat DMI clues, just like on the daily chart. The impending bearish cross on the MACD keeps the BTC sellers optimistic.
Adding strength to the downside bias is the looming death cross between the 100-bar and 200-bar SMA, with the short-term SMA crossing the broader one from above and suggesting further declines.
As a result, the BTC appears well-set to approach the lower BB support of near $105,500 and may bounce from that. If not, then the 78.6% Fibonacci retracement of its June-October upside, near $104,280, could act as the final line of defense for the BTC buyers ahead of highlighting deeper levels discussed on the daily chart.
Alternatively, the 61.8% Fibonacci ratio of $109,100 and the upper BB of $111,800 could restrict immediate BTC recovery before the convergence of the 100-bar and 200-bar SMAs, close to $114,700-$114,900.
Beyond that, the higher levels discussed on the daily chart will be in the spotlight.
Conclusion
Bitcoin’s recent weakness gains support from key technical breakdowns, market consolidation, and short-term bearish momentum indicators, suggesting further fall in the prices toward the week’s end. However, the $98,000 support holds the key to defending the BTC’s broad bullish trend.


