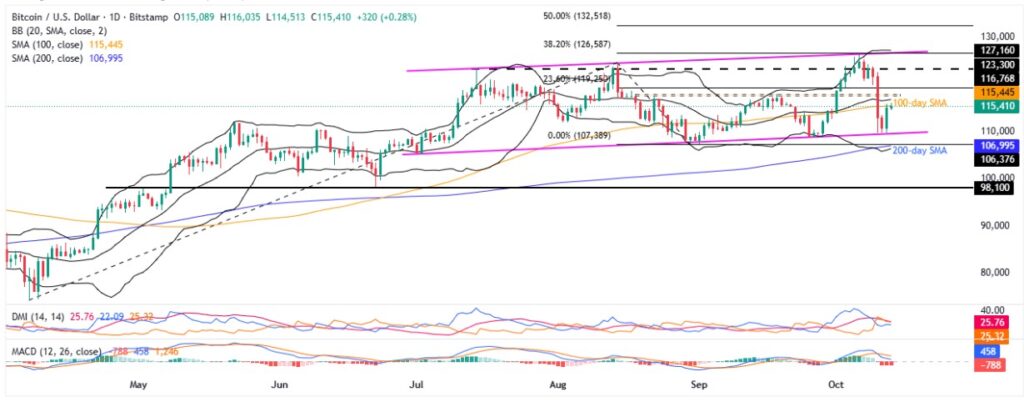
- Bitcoin price struggles to keep recovery from a two-week low, poking 100-day SMA after the sharpest rebound since October 01.
- 15-week-old bullish channel defend BTC’s upside bias, despite bearish MACD, DMI clues.
- 100-day SMA caps Bitcoin’s short-term recovery, flagging risk of a pullback toward 200-day SMA.
- Bitcoin’s broader uptrend remains intact above the key $98,240–$97,940 support zone.
Bitcoin (BTC) price stays defensive around $115K early Monday, struggling to extend Sunday’s strong rebound within a 15-week bullish channel.
Notably, the BTC snapped a three-day losing streak by bouncing off the crucial ascending trend channel’s bottom the previous day as market sentiment improved on U.S. President Donald Trump’s conciliatory tone after levying 100% tariffs on China.
Read Details: Cryptocurrency Weekly Price Prediction: BTC, ETH & XRP Plummet under U.S. Risk Pressure
Still, the crypto major jostles with the 100-day Simple Moving Average (SMA) hurdle amid bearish signals from the Moving Average Convergence Divergence (MACD) and the Directional Movement Index (DMI) momentum indicators.
It’s worth observing that a pullback in the trading volume and steady market capitalization (market cap) raise doubts on BTC’s latest run-up. According to Santiment, Bitcoin’s daily trading volume eases for the third consecutive day after hitting a three-month-high, close to $92.41 billion, whereas the market cap stabilizes near $2.29 trillion, following a bounce from a fortnight’s low the previous day.
With this, Bitcoin’s recent recovery faces increasing risk, even as the broader bullish trend stays intact.
Bitcoin Price: Daily Chart Points To Short-Term Weakness

Bitcoin bounces off a 15-week rising support line, forming part of a multi-week bullish channel, as the market consolidates amid the U.S. holiday, especially after Trump’s softened tone toward China. However, the 100-day SMA joins bearish signals from DMI and MACD to flag short-term downside bias surrounding the BTC.
That said, the MACD posts the bearish signals (red histogram) to keep sellers hopeful. Meanwhile, the Average Directional Index (ADX, red) line and the Downmove (D-, orange) line both stay above the 25.0 neutral level, as well as past the Upmove (D+, blue) line. This suggests a growing downside momentum and no upside bias, despite the recent rebound.
Hence, for the BTC bulls to retake control, a daily closing beyond the 100-day SMA hurdle of $115,445 is the least required.
Beyond that, a seven-week-old horizontal resistance area surrounding $117,500-$117,800 and the horizontal resistance from July, close to $123,300, guards the BTC’s further rise.
However, a convergence of the rising trend line from July, forming part of the said channel, and the 38.2% Fibonacci Extension (FE) of its April-August move, close to $126,600, is the key hurdle for the bulls to cross, along with the upper Bollinger Band (BB) of $127,200, before targeting the $130K threshold and 50% FE hurdle near $133K.
On the contrary, the BTC’s failure to provide a daily closing beyond the 100-day SMA could drag it back to the aforementioned bullish channel’s bottom, surrounding $109,500.
If Bitcoin slides beneath the $109,500 key support, the 200-day SMA and the lower BB, respectively near $107K and $106,400, will gain the bear’s attention.
Above all, a 5.5-month-old horizontal support area, surrounding $98,240-$97,940, acts as the final defense of the BTC bulls.
Bitcoin Price: Four-Hour Chart Highlights 200-bar SMA Hurdle

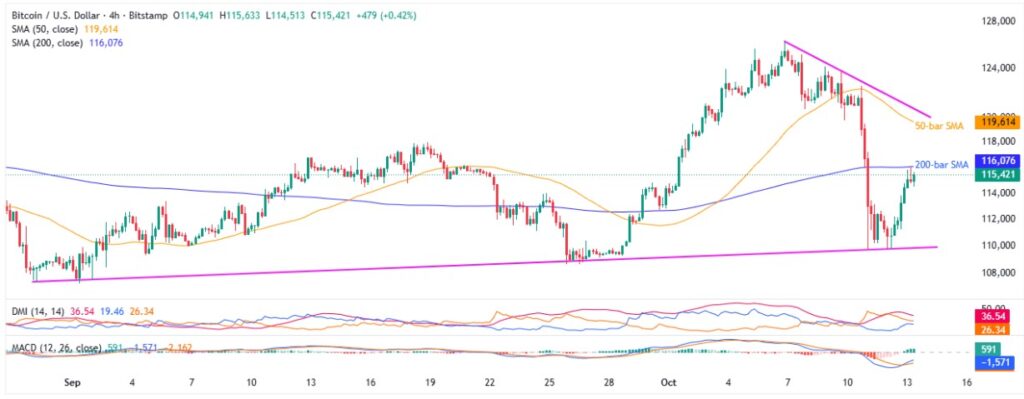
On the four-hour chart, Bitcoin buyers jostle with the 200-bar SMA hurdle, following its rebound from the multi-week support line, forming part of the bullish channel.
The BTC recovery gains strength from the bullish MACD signals (green histograms), but stronger positions of the DMI’s ADX (red) and Downmove (orange) lines challenge the buyers, especially near the 200-bar SMA hurdle surrounding $116,100.
Even if the Bitcoin buyers manage to cross the $116,100 hurdle, September’s peak surrounding $118K, 50-bar SMA of $119,600, and a week-old falling resistance line, close to $121K, could test the upside momentum before giving control to the bulls.
Alternatively, BTC pullback could revisit the stated support line near $109,500, whereas lows marked in September around $108,600, and $107,260, might test the bears afterward, before the daily chart’s lower levels.
Conclusion
Bitcoin defends a broader uptrend within a multi-week ascending trend channel. The recovery moves, however, face multiple resistance levels, and the momentum is still weak, suggesting a short-term pullback in prices.
Also read: Bitcoin Price Crashes to $105K Amid $2.6B Liquidations, Here’s Why


