- Bitcoin price remains under pressure within a $20K range, trading below key resistance and heading for a weekly loss after a weak Thursday.
- Bullish momentum indicators and sustained trading beyond key SMAs defend a broad upside outlook, but failure to cross $123,300 teases short-term BTC sellers.
- BTC’s current weakness targets the sub-$120K zone, but falling below the 100-day SMA looks challenging.
- Downside break of $106,600 puts broad bullish outlook at risk, while $126,600 breakout signals Bitcoin’s strong rally.
Bitcoin (BTC) reached $121,300 early Friday, following a downbeat Thursday and leaning toward a weekly loss.
With this, the crypto major remains locked within a broad $20,000 range, while staying beneath the key short-term resistance, signaling potential for further weekly losses.
Despite being range-bound, bullish momentum indicators, such as the Moving Average Convergence Divergence (MACD) and Directional Movement Index (DMI), along with BTC’s sustained trading above the key Simple Moving Average (SMA), defend the overall bullish bias.
However, Bitcoin’s steady placement below a multi-month horizontal resistance joins the market consolidation, a stronger U.S. Dollar, and mixed risk factors to attract short-term sellers. Plus, this week’s $4.3 billion Bitcoin options expiry, with maximum pain near $117K, adds to the short-term downside pressure.
Also read: Crypto Options: Bitcoin Trades near $121K ahead of $4.3 billion BTC Options Expiry
That said, a sturdy trading volume and a downbeat market capitalization (market cap) also defend the short-term downside bias. According to Santiment, Bitcoin’s daily trading volume pokes the week’s upper limit, currently near $73.39 billion, while the market cap drops to a three-day low of $2.42 trillion.
With this, Bitcoin looks poised to extend short-term downside, but the overall bullish outlook holds unless the quote breaks the $106,600 key support.
Bitcoin Price: Daily chart suggests limited downside room

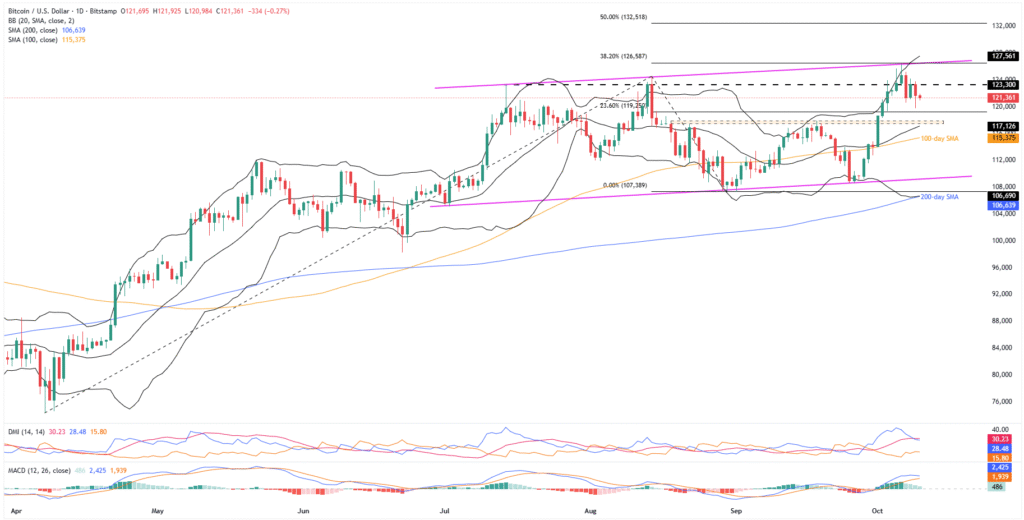
Bitcoin’s sustained trading beneath a 12-week horizontal resistance surrounding $123,300 contradicts bullish signals from the MACD (green histograms) and DMI momentum indicators to confuse traders. However, firmer U.S. Dollar easing bullish bias of the oscillators (momentum indicators), as the prices retreat, suggests short-term downside in prices.
That said, the DMI’s Upmove (D+, blue) line recently slipped beneath the Average Directional Index (ADX, red) line and suggests a short-term consolidation in prices. The Upmove line, however, remains well past the Downmove (D-, orange) line, as well as beyond the neutral 25.00 level, to portray overall strong upside momentum.
With this, the BTC looks poised to drop toward the 23.6% Fibonacci Extension (FE) of Bitcoin’s April-August moves, around $119,250, before testing a 1.5-month-long support area near $117,500-$117,800.
If BTC drops beneath the $117,500 support, the middle BB and 100-day SMA, close to $117,100 and $115,375 in that order, will be crucial to watch as a downside break of the same could direct the sellers toward an ascending support line from early July, near $109,300.
Notably, Bitcoin’s downside past $109,300 seems unlikely, but if it happens, a convergence of the 200-day SMA and the lower BB, near $106,600, will be the last line of defense for bulls. A break below this could shift control to the sellers, threatening the broader upside trend.
On the upside, the aforementioned horizontal resistance from July, close to $123,300, guards the BTC’s immediate recovery.
However, a convergence of the rising trend line from July and 38.2% FE, close to $126,600, is the key hurdle for the bulls to cross, along with the upper BB of $127,600, before targeting the $130K threshold and 50% FE hurdle near $133K.
Bitcoin Price: Four-Hour Chart Highlights Bullish Channel

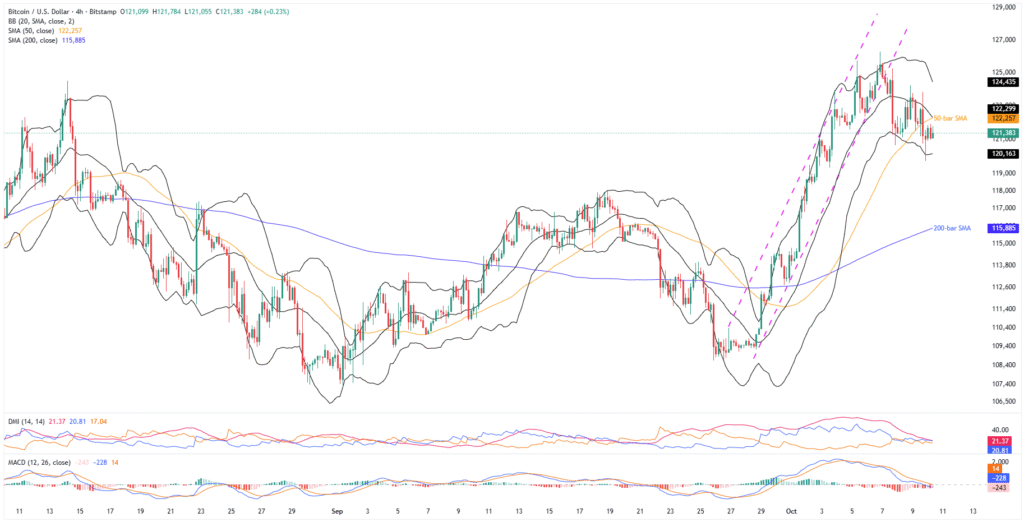
On the four-hour chart, the early-week rejection of the bullish trend channel and the latest breakdown of the 50-bar SMA join the bearish MACD signals to lure short-term sellers.
Meanwhile, most DMI lines are below the 25.00 neutral mark and ADX tops, followed by D+ and then the D-, suggesting weak downside momentum.
With this, Bitcoin looks set to test the lower BB support of $120,200, a break of which could direct sellers to September’s high near $117,970, the 200-bar SMA support of $115,885, and deeper levels discussed on the daily chart.
Alternatively, BTC rebound needs validation from the 50-bar SMA hurdle of $122,250, quickly followed by the middle BB surrounding $123K.
Should Bitcoin buyers keep control beyond $123K, the $123,300 discussed earlier, will be the last defense of sellers before suggesting a rally toward the daily chart’s highest levels.
Conclusion
Bitcoin’s recent weakness gains support from key technical breakdowns, market’s consolidation, options expiry, and short-term bearish momentum, suggesting further weakness toward the week’s end. However, the $106,600 support holds the key to defending the BTC’s broad bullish trend.
Also read: Bitcoin Bull Run In Trouble, Risks Nosedive to $116.5K


