- Bitcoin price stabilizes at a three-week low, following the biggest slump since mid-August.
- BTC bounces off 12-week support as the market consolidates ahead of the Fed’s inflation data.
- Bearish MACD, DMI signals join the downside break of multi-month support to fuel sellers’ confidence.
- BTC’s short-term declines look imminent, but a clear break below the 200-day SMA can challenge the broader bullish outlook.
Bitcoin (BTC) stays defensive at a three-week low near $109,000 early Friday, following the biggest daily fall since mid-August the previous day.
The BTC’s latest rebound could be linked to the market’s positioning for the U.S. Core Personal Consumption Expenditure (PCE) Price Index for August, the Federal Reserve’s (Fed) preferred inflation gauge. Also testing the sellers is an ascending support line from early July.
Also read: Crypto Options: BTC remains Sideline amid $22.6 Billion September Options Expiry Today!
However, a decisive break below the five-month trend line support, now resistance, joins bearish signals from the Moving Average Convergence and Divergence (MACD) and the Directional Movement Index (DMI) momentum indicators keep sellers confident.
Strong trading volume also boosts sellers’ morale, even if the market capitalization (market cap) portrays a corrective bounce from the lowest level since September 01. According to Santiment, Bitcoin’s daily trading volume stays firmer around $68.71 billion, after hitting a five-week high the previous day, whereas the market cap modestly improves to $2.18 trillion.
While BTC’s short-term decline looks promising, it’s sustained trading below the 200-day Simple Moving Average (SMA) becomes necessary for bears to retake control.
Bitcoin Price: Daily Chart Points To Short-Term Weakness

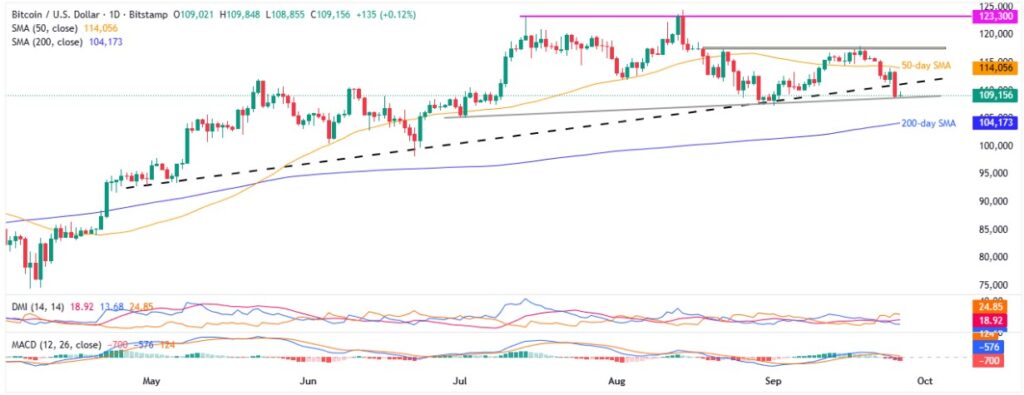
Bitcoin bounces off a 12-week rising support line as the market braces for the key U.S. data and month-end moves. However, Thursday’s clear break below a five-month trendline support, now immediate resistance, joins bearish signals from DMI and MACD to defend the downside bias.
That said, the MACD posts the strongest bearish signals (red) in a month. Meanwhile, the DMI’s Downmove (D-, orange) line tops both the Average Directional Index (ADX, red) and the Upmove (D+, blue) lines, staying close to the neutral 25.00 level. This suggests strong downside momentum and no upside bias, despite the recent rebound.
As a result, BTC’s rebound from the immediate support near $108,650 looks unconvincing while it remains below the former support–now resistance–line from April, seen around $111,500 at press time.
Even if Bitcoin clears the $111,500 hurdle, the 50-day SMA and a six-week horizontal resistance, respectively near $114,100 and $117,500-$117,800, could challenge the upside momentum.
Beyond that, a two-month-old horizontal resistance near $123,300, the all-time high around $124,500, and the $130K psychological magnet could flash on the bull’s radar.
On the flip side, a daily close beneath the $108,650 support could quickly drag the Bitcoin price to the 200-day SMA support of $104,170.
Should the BTC remain bearish past $104,170, June’s low of $98,240 and late April swing lows around $91,800 could act as the final defense of the buyers ahead of highlighting April’s bottom of $74,434 for the bears.
Bitcoin Price: Four-Hour Chart Defends Bearish Bias

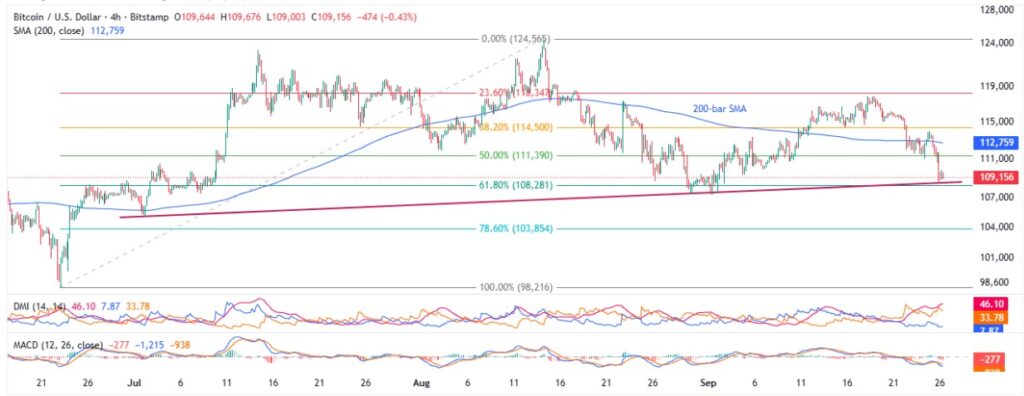
On the four-hour chart, Bitcoin’s downside bias gains additional support from a clear break below the 200-bar SMA, currently around $112,760, even if the multi-week support line stops sellers near $108,650.
Notably, the 61.8% Fibonacci retracement of its June-August upside, around $108,280, acts as an additional downside filter for the BTC bears to watch past $108,650, and before approaching the deeper levels discussed on the daily chart.
Meanwhile, the monthly high surrounding $118K could also challenge Bitcoin buyers, apart from the immediate resistances mentioned earlier.
Conclusion
While Bitcoin’s decisive break below key technical supports and bearish momentum signals point to further short-term weakness, sellers may still face hurdles from multiple support levels before gaining full control of the trend.
Also read: Crypto Morning News: Bitcoin Sinks to 109K as Dollar Rises on Growth and Inflation Fears


