- Bitcoin price hovers at a three-week high, maintaining its early-week breakout to underpin the bullish bias.
- A clear break of the multi-month resistance line, the 50-day EMA, and confirmation of an inverse head-and-shoulders pattern keep BTC buyers hopeful.
- Bullish momentum signals from DMI and MACD also back Bitcoin’s push toward the $119K target.
- The $112,800 acts as key short-term support, while overall bullish bias holds above the 200-day EMA.
- Market’s positioning for FOMC test Bitcoin buyers amid overall bullish outlook.
Bitcoin (BTC) price remains sidelined at a three-week high, making rounds to $115,000 early Friday, as crypto traders prepare for next week’s U.S. Federal Reserve (Fed) Interest Rate Decision amid dovish bias.
Still, BTC’s early-week bullish breakout, sustained trading beyond the key Exponential Moving Averages (EMAs), and upbeat momentum indicators like the Moving Average Convergence and Divergence (MACD) and the Directional Movement Index (DMI) keep buyers hopeful.
Notably, the crypto major’s trading volume also recovers while approaching the weekly high, following Thursday’s pullback. Meanwhile, its market capitalization (market cap) seesaw at the highest level since August 23. According to Santiment, Bitcoin’s daily trading volume rises to 52.2 billion, and the market cap steadies at the multi-day peak near $2.29 trillion at the latest, signaling sturdy confidence among the BTC buyers.
Against this backdrop, Bitcoin looks poised to secure a second straight weekly gain, strengthening its overall bullish momentum.
Bitcoin Price: Daily Chart Points To Multiple Upside Hurdles

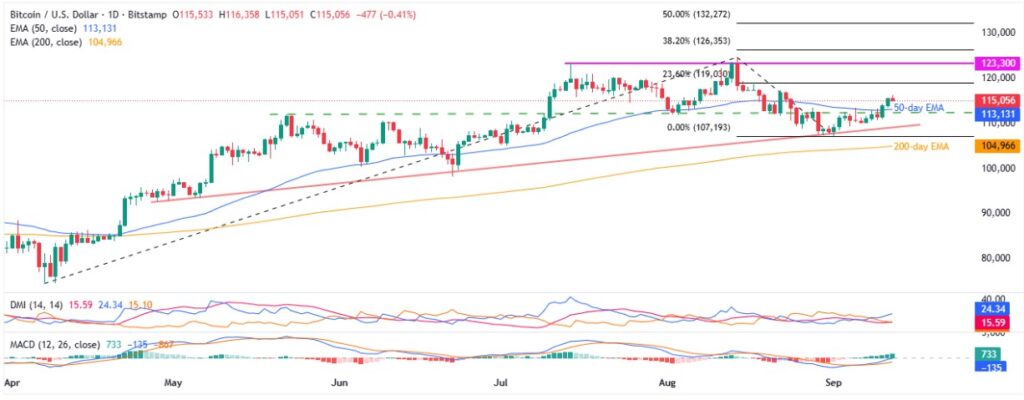
Bitcoin’s steady trading beyond the resistance-turned-support line from late May and the 50-day EMA, combined with bullish signals from MACD and DMI, bolsters the crypto major’s upside outlook.
That said, MACD histograms (green) are the most bullish in over two months, portraying BTC’s upward momentum.
Smiliarly, the DMI’s Upmove line (Blue) holds the top spot on the daily chart, staying near the 25.0 neutral level to indicate buying strength. However, the Average Directional Index (ADX in red) and the Downmove (D- in Orange) seesaw near 15.00, reflecting the need for a strong bullish catalyst to fuel the prices beyond the immediate resistance.
This highlights the 23.6% Fibonacci Extension (FE) of Bitcoin’s April-September moves, close to $119K, a break of which could propel prices toward a two-month-old horizontal resistance near $123,300.
Beyond that, the all-time high around $124,500 holds the key to BTC’s potential rally toward the 38.2% and 50% FE hurdles, respectively near $126,300 and $132,300, with the $130K threshold likely acting as an intermediate halt.
Alternatively, the 50-day EMA and the previous resistance line limit short-term BTC pullbacks around $113,100 and $112,200 in that order.
Below that, an ascending support line from late April, close to $109,300, appears to be an important level to watch, before the monthly low of $107,270.
Above all, the 200-day EMA near $104,970 becomes the final defense of the Bitcoin buyers, after which June’s low of $98,250 should grab the bear’s attention.
Bitcoin Price: Four-Hour Chart Defends Bullish Bias

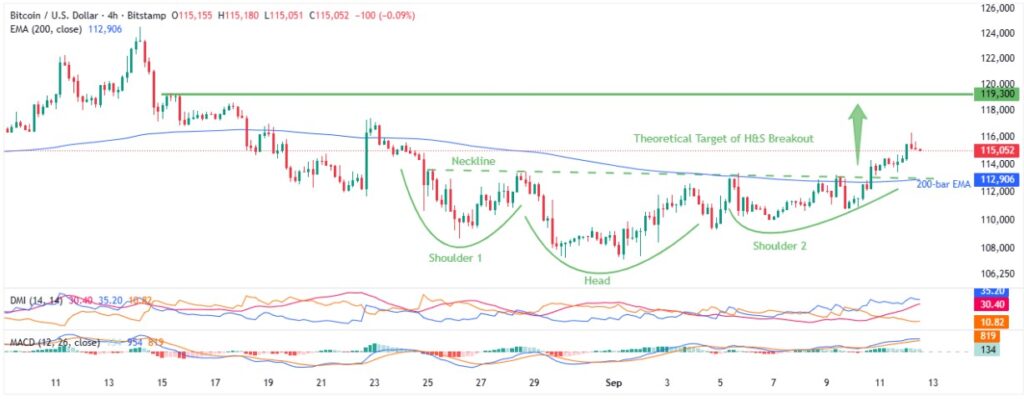
On the four-hour chart, Bitcoin holds onto the early-week confirmation of a two-week-old Head-and-Shoulders (H&S) bullish chart pattern. The upside break also gains support from bullish MACD signals and the DMI’s strong Upmove line (D+ in Blue), beyond the 25.00 neutral limit.
With this, the BTC appears well-set to visit the H&S formation’s theoretical target surrounding $119K unless it drops beneath the $112,900-$112,800 key support zone comprising the 200-bar EMA and the H&S’s neckline.
That said, the late August swing high, surrounding $117,400, might offer an immediate halt to the buyers, whereas the $120K threshold and the previous monthly peak near $124,500 could lure the BTC bulls past $119,300.
Alternatively, Bitcoin’s pullback may aim for the weekend’s low near $110K before the monthly trough of $107,270 and the deeper levels discussed on the daily chart.
Conclusion
Despite the latest consolidation, Bitcoin keeps the early-week bullish breakouts and gains support from the upbeat momentum indicators, keeping the buyers hopeful of meeting the $119K. Beyond that, the market’s sentiment ahead of the next week’s Federal Open Market Committee (FOMC), as well as the industry news, will be crucial to observe for fresh directives. Still, the BTC’s bullish bias stays in place after snapping a three-week downtrend, while bracing for the second weekly gain, reinforcing the broader upside outlook.
Also read: Market Digest: Bitcoin Climbs to 115K as Fed Cut Bets and NATO-Clash Shake Markets


