- Bonk price hits fortnight low during five-day losing streak.
- 21-day SMA breakdown, bearish MACD signals, and absence of oversold RSI lure BONK bears.
- Sellers have a free hand before hitting six-month support; the 200-day SMA is the last defense of bulls.
- BONK/USD recovery remains elusive below the “Golden Fibonacci Ratio”.
Bonk (BONK/USD) price drops for the fourth consecutive day as bears cheer a two-week bottom surrounding $0.00002776, before bouncing off to $0.00002851 heading into Wednesday’s U.S. session. Despite the latest fall, BONK still gains 96% during July as we write.
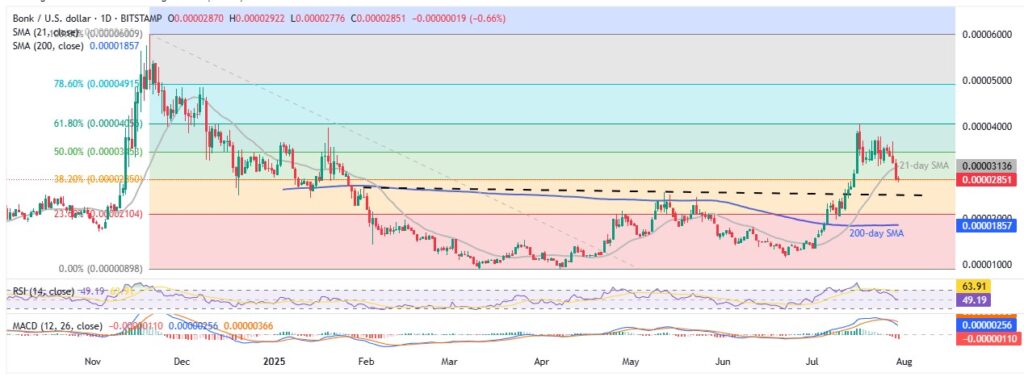
In doing so, BONK extends the early-month reversal from a 61.8% Fibonacci Retracement, also known as the “Golden Fibonacci Ratio,” of the downturn from November 2024 to April 2025. Additionally, Tuesday’s clear downside break of the 21-day Simple Moving Average (SMA) and bearish signals from the Moving Average Convergence Divergence (MACD) indicator also add strength to the downside bias, especially when the 14-day Relative Strength Index (RSI) is near the 50.0 neutral level.
Also read: Bonk Price Analysis: BONK’s Price Jumps 46% in First Week of July; Are You Buying?
BONK: Daily Chart Signals Limited Downside Room

With a clear reversal from the key Fibonacci Ratio and a downside break of the 21-day SMA, joining the bearish MACD signals and an absence of the oversold RSI, the BONK/USD pair appears well-set to drop further towards a horizontal support comprising levels marked since January 31, close to $0.00002500.
However, the 200-day SMA support of $0.00001850 could challenge the quote’s further downside, if not, then June’s bottom of $0.00001153 might act as an intermediate halt during the south-run targeting the yearly low surrounding $0.00000885.
Meanwhile, BONK recovery can initially aim for the 21-day SMA resistance of $0.00003136 before targeting the 50% and 61.8% Fibonacci ratios, respectively, near $0.00003450 and $0.00004060.
Should BONK/USD buyers keep the reins past $0.00004060, the 78.6% Fibonacci retracement level surrounding $0.00004915 and the $0.00005000 threshold might act as intermediate halts before directing prices toward the late 2024 peak of $0.00006000.
BONK/USD: Bears Run Out of Steam on Four-Hour Chart

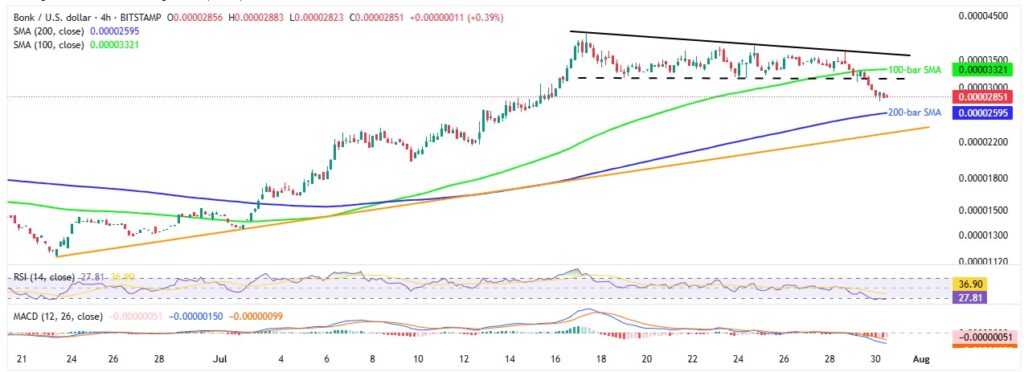
BONK price remains under pressure as it trades below the 100-bar SMA and a two-week-old symmetrical triangle on the four-hour chart, with bearish MACD signals keeping sellers hopeful. However, the RSI line is deep into the oversold territory, currently near 27.00, and suggests a potential corrective bounce.
With this, the 200-bar SMA of around $0.00002595 stands out as a key short-term support and possible recovery zone. If BONK bears dominate past the 200-bar SMA, the next major support will be an ascending trend line from late June, near $0.00002320, before BONK risks a deeper drop, as outlined on the daily chart.
On the upside, immediate resistance is seen at the lower boundary of the said triangle near $0.00003160, followed by the 100-bar SMA at $0.00003320.
Following that, the stated triangle’s upper limit at $0.00003640 could test the BONK buyers before directing them toward the monthly high at $0.00004061 and possibly higher levels mentioned in broader timeframes.
Overall, BONK appears poised for further correction to pare its massive 100% monthly gains, though oversold RSI conditions and strong technical support suggest the downside could be limited—at least for now.


