- Bonk price jumps nearly 46% at the beginning of July and continues to keep the upside momentum.
- RSI signals overbought conditions, pointing to consolidation near the key trendline from late January.
- BONK buyers stay hopeful as bullish MACD signals, breakout above major resistance hint at reversal of yearly losses.
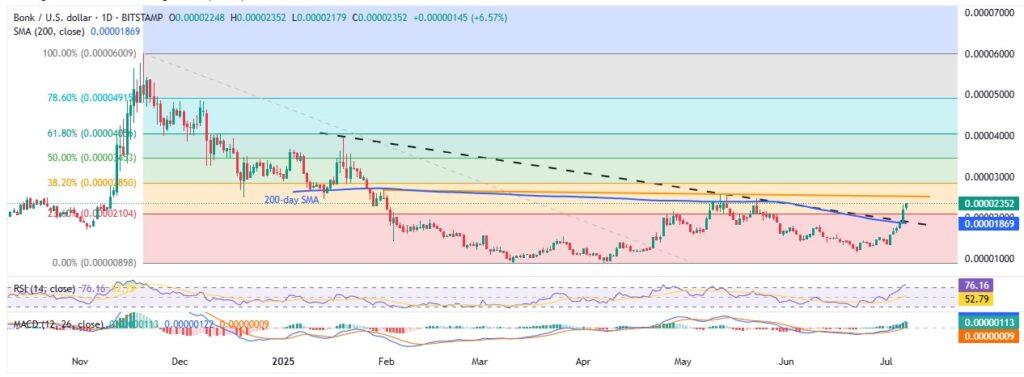
Bonk price (BONK/USD) rises 3.0% to $0.00002350 during Monday’s U.S. session, extending July’s sharp rally after breaking above key resistance, now turned support. So far, BONK has gained nearly 46% this month, boosted by a breakout above both the descending trend line from mid-January and the 200-day Simple Moving Average (SMA).
Bullish signals from the Moving Average Convergence Divergence (MACD) support further upside, though the overbought Relative Strength Index (RSI) suggests a possible short-term pause. Still, BONK remains well-positioned to erase its 2025 losses.
BONK/USD: Daily chart portrays start of bullish trend

Source: Tradingview
Despite the 14-day RSI crossing above 70.00 to indicate overbought conditions, Bonk (BONK/USD) buyers remain optimistic following an upside break of a 5.5-month-old descending trend line and the 200-day SMA, currently near $0.00001870. The next key resistance is a falling trend line from February 1, located around $0.00002530 at press time.
If BONK breaks above that level, prices may enter a short-term consolidation phase near May’s high of $0.00002575 and February’s peak of $0.00002650. A sustained move above $0.00002650 could shift focus to the yearly high of $0.00003976, marked in January.
On the downside, sellers may not gain control unless there’s a daily close below the now-support zone at $0.00001870. If that breaks, a quick drop to early June’s swing low of $0.00001417 is possible. Further support rests at the previous monthly low of $0.00001157, followed by the “double bottom” zone near $0.00000885–$0.00000895 — which also includes BONK’s all-time low.
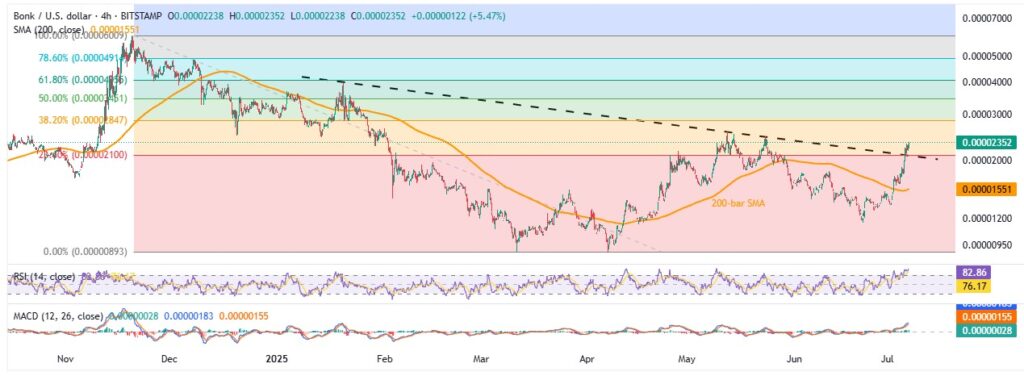
BONK/USD: Four-Hour chart signals price consolidation

Source: Tradingview
On the four-hour chart, the RSI is deeply overbought at around 81.00, hinting at an immediate consolidation for BONK/USD — particularly near May’s peak of $0.00002573. If bulls hold above this level, the next target will be January’s yearly high at $0.00003976.
On the flip side, short-term pullbacks may find support near $0.00002100 — a key confluence of the 23.6% Fibonacci retracement (from the November 2024 to March 2025 drop) and a descending trend line from January. Below that, the 200-bar SMA around $0.00001550 stands as the final bullish defense before revisiting the yearly low and record bottom marked on the daily chart.
Overall, Bonk appears set to recover its 23% yearly loss — and despite how extreme July’s rally may seem, it could just be the beginning of a broader bullish move.


