- Cardano, Dogecoin soar 60% in July, break key resistances to hit multi-month highs; bulls now target yearly tops.
- Overbought RSI tests DOGE at five-month high, ADA jumps over 7% intraday to approach March’s peak.
- ADA targets $1.1555–$1.1750 resistance, DOGE flags $0.3050 as the key nod to new yearly highs.
Altcoin momentum heats up as Cardano (ADA/USD) and Dogecoin (DOGE/USD) blast through key resistance levels, clocking 60%+ monthly gains and reaching multi-month highs.
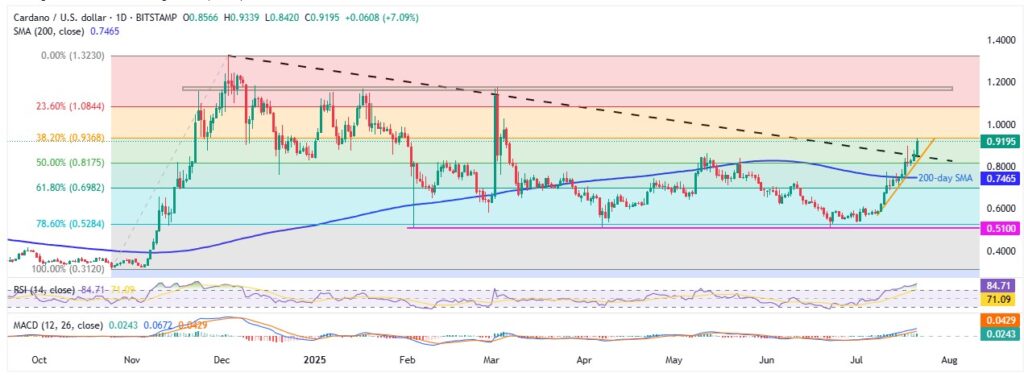
ADA/USD jumps over 7.0% intraday to $0.9200 during Monday’s U.S. session—its highest since early March—after breaking a key descending trendline from December, even as the 14-day Relative Strength Index (RSI) signals overbought territory. That said, DOGE/USD hit a five-month high around $0.2780 by the press time, up nearly 1.70% intraday while defending a breakout above a seven-month resistance band.
Bullish cues from the Moving Average Convergence Divergence (MACD) indicator support the case for more upside, as both coins set their sights on yearly tops. Let’s dive into the technicals!
ADA/USD: Daily Chart Suggests Gradual Run-up To Yearly Top

ADA/USD maintains strong bullish momentum after a clear breakout above the seven-month resistance line—now turned support—while holding firm above the 200-day Simple Moving Average (SMA) and a two-week ascending trendline. Adding to that are the bullish MACD signals, and the setup points to a potential run toward the yearly top, although the overbought 14-day RSI may trigger temporary pullbacks along the way.
That said, the 38.2% and 23.6% Fibonacci Retracements of the quote’s October-December 2024 run-up, respectively near $0.9370 and $1.0845, appear short-term targets for the Cardano bulls, along with March 05 high of $1.0275 and the $1.000 psychological magnet.
However, a horizontal area comprising levels marked since November 2024, near $1.1555 and $1.1750 appears a tough nut to crack for the ADA bulls before they aim for 2024 high of $1.3241.
Alternatively, ADA pullback remains elusive unless it drops back below the previous resistance line from December, close to $0.8520 by the press time. Even so, an ascending support line from July 08 and the 200-day SMA, around $0.8130 and $0.7465 in that order, could challenge the bears before giving them control.
DOGE/USD: Daily Chart Hints At Multiple Upside Hurdles

While Dogecoin (DOGE/USD) mirrors Cardano’s bullish breakout, it seesaws near a five-month high as buyers respect overbought signals on the 14-day RSI. Still, the bullish momentum remains intact, supported by a sustained break above a seven-month resistance zone, the 200-day SMA, and a descending trendline from December 2024—alongside positive MACD cues.
The next immediate test lies at the mid-February swing high around $0.2870, with a broader resistance zone between $0.2975 and $0.3055—marked by multiple price reactions since November 2024—posing a critical challenge.
A clear break above $0.3055 could pave the way toward the $0.4000 psychological mark and the yearly peak near $0.4340.
Conversely, a daily close below $0.2625–$0.2540 (seven-month breakout zone) could invite a short-term pullback toward the 200-day SMA at $0.2195. Even then, strong support is likely around the December trendline near $0.1660 and the horizontal base at $0.1430, making it tough for bears to extend downside momentum.
Conclusion
All things considered, Cardano (ADA/USD) currently holds the technical upper hand over Dogecoin (DOGE/USD), positioning itself for a potential quick run toward its yearly peak. That said, both altcoins continue to command strong bullish interest and warrant close monitoring for sustained upside opportunities.


