- Cardano price hits a weekly low inside a 2.5-month-old bullish channel, extending a break below three-week support.
- Bearish MACD signals, neutral RSI reinforce ADA’s short-term downside bias.
- Multi-month bullish channel, key SMA confluence can challenge ADA bears before giving them control.
- Cardano’s short-term downside looks likely, but a medium-term recovery and broader consolidation phase may still take hold.
Cardano (ADA) price slides to $0.8280, its lowest since August 12, marking a second straight day of losses ahead of Friday’s U.S. trading session.
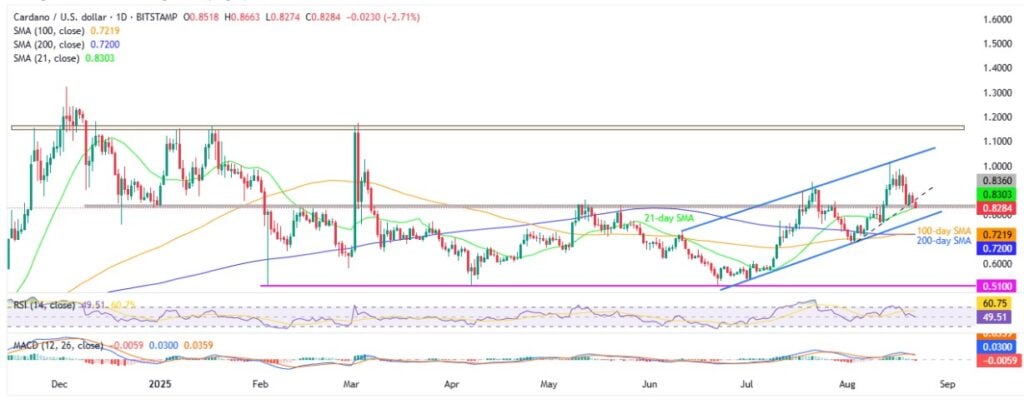
In the process, the ADA extends its downside break of a three-week-old ascending trend line support, now immediate resistance. The recent fall also takes clues from the steady conditions of the 14-day Relative Strength Index (RSI) and bearish Moving Average Convergence Divergence (MACD) signals.
Meanwhile, Cardano’s daily trading volume drops to the lowest level in nearly two weeks, to $1.19 billion, according to Santiment, portraying thin trader participation during the decline. Further, the market cap also retreats for the second straight day to $30.15 billion.
Despite the recent fall and short-term downside bias, the ADA’s sustained trading within an upward-sloping trend channel from early June and above the key Simple Moving Average (SMA) confluence challenges the sellers on a medium to long-term basis.
Cardano Price: Daily Chart Favors Short-term Downside

A clear downside break of the three-week support, bearish MACD signals, and steady RSI together suggest further weakness in the ADA prices. However, a daily closing beneath an eight-month-old horizontal support zone and the 21-day SMA, respectively near $0.8360-$0.8350 and the $0.8300, becomes necessary for the intraday sellers.
Below that, the multi-month bullish channel’s bottom surrounding $0.7750 will be in the spotlight, as a break of which will shift the market’s attention to the last defense of ADA buyers, namely a convergence of the 100-day and 200-day SMA surrounding $0.7200.
Should the quote remain weak past $0.7200, it becomes vulnerable to a slump towards a horizontal support from February around $0.5100.
On the flip side, Cardano’s recovery remains elusive unless jumping back beyond the immediate support-turned-resistance surrounding $0.8600.
Beyond that, the $0.9000 threshold, July’s peak of $0.9340, and the monthly high of $1.0190 could challenge the ADA bulls before directing them to the aforementioned bullish channel’s top near $1.0500.
Cardano Price: Four-Hour Chart Points To Multiple Supports

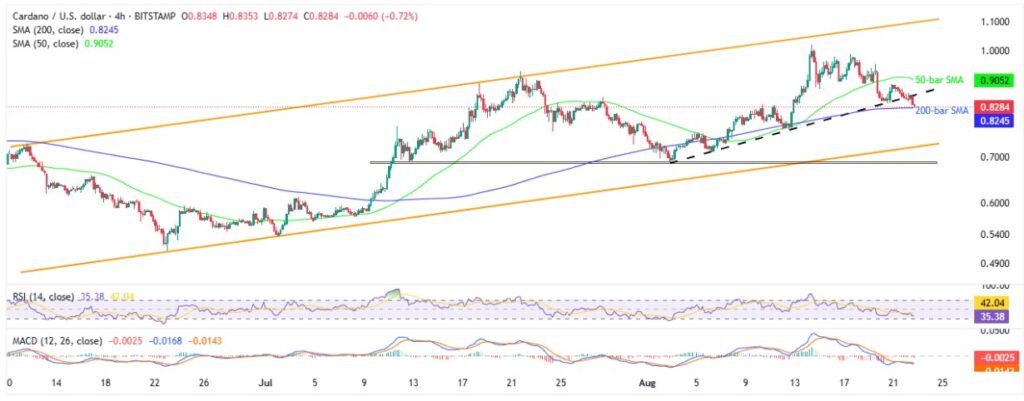
Cardano’s sustained trading beneath the 50-bar SMA, a clear downside break of a three-week support, and bearish MACD signals direct prices toward the 200-bar SMA support of $0.8245. Still, the RSI approaches the oversold territory of around 30.00 and hence highlights each upcoming support as a potential recovery point.
Should the quote fail to rebound from the 200-bar SMA support of $0.8245, it can challenge the bullish channel’s support surrounding 0.7750, with the $0.8000 threshold acting as an intermediate halt.
It’s worth noting that multiple lows marked since July 11 highlight an additional downside filter for the ADA bears to watch around $0.6880-60, even if they manage to defy the bullish channel by breaking $0.7750 support.
Alternatively, the support-turned-resistance and the 50-bar SMA guard short-term ADA recovery near $0.8600 and $0.9055 in that order. Beyond that, the daily chart levels will gain the market’s attention.
Conclusion
Cardano’s break below short-term support, along with steady RSI and bearish MACD signals, suggests near-term weakness. However, the bullish channel, key Simple Moving Average (SMA) confluence, multiple downside supports, and a nearly oversold RSI on the four-hour chart help defend the medium-term bullish bias. Notably, ADA remains within its yearly trading range, supporting a potential long-term consolidation pattern.
Also read: Market Digest: Bitcoin Dips to 112K as Powell Speech Looms and Labor Weakness Weighs on Markets


