- Cardano bounces off seven-month low but struggles to regain bullish momentum.
- ADA/USD recovery faces resistance from 50-bar SMA and former support zone.
- RSI, MACD favors bulls —watch for $0.6700 if $0.6070 breaks.
Cardano (ADA/USD) struggles to defend the week-start recovery from a seven-month support zone, trading indecisively near $0.5830 during Tuesday’s U.S. trading session.
The ADA/USD rebound draws support from the 14-day Relative Strength Index (RSI) and improving Moving Average Convergence Divergence (MACD) signals. However, buyers face strong resistance on the four-hour chart from the 50-bar Simple Moving Average (SMA) and a seven-week-old previous support line, which now acts as a barrier.
Meanwhile, the daily chart suggests that ADA has a long way to go before attracting renewed buying interest and returning to a convincing bullish setup.
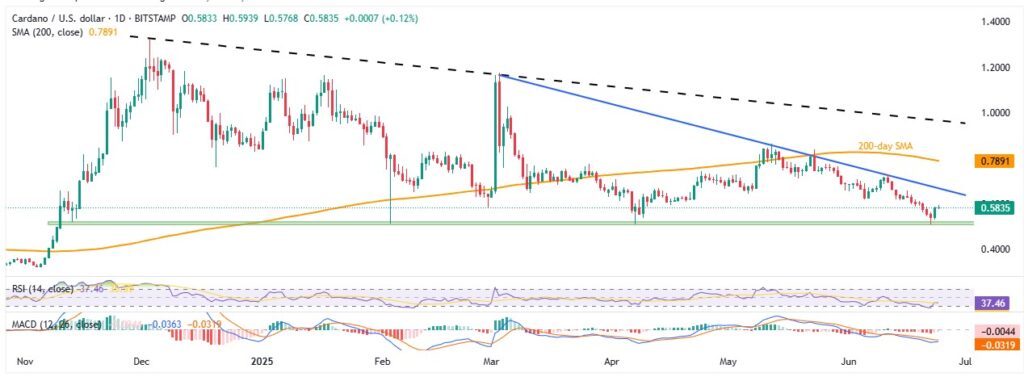
ADA/USD: Daily chart signals room for recovery

Source: Tradingview
Cardano shows signs of recovery as the RSI rebounds from oversold territory and the MACD indicator signals an impending bullish crossover. This setup directs attention to a downward-sloping resistance line from early March, near $0.6700.
A daily close above $0.6700 could trigger further upside toward the $0.7000 psychological level, followed by the 200-day SMA at $0.7895, closely aligned with the $0.7900 mark.
However, bulls should stay cautious while the price holds below a longer-term descending trendline from December 2024, currently near $0.9750.
On the downside, a break below the seven-month-old horizontal support zone around $0.5200–$0.5100 could strengthen bearish momentum. That would expose the late October 2024 swing high at $0.3650 and the November low at $0.3206.
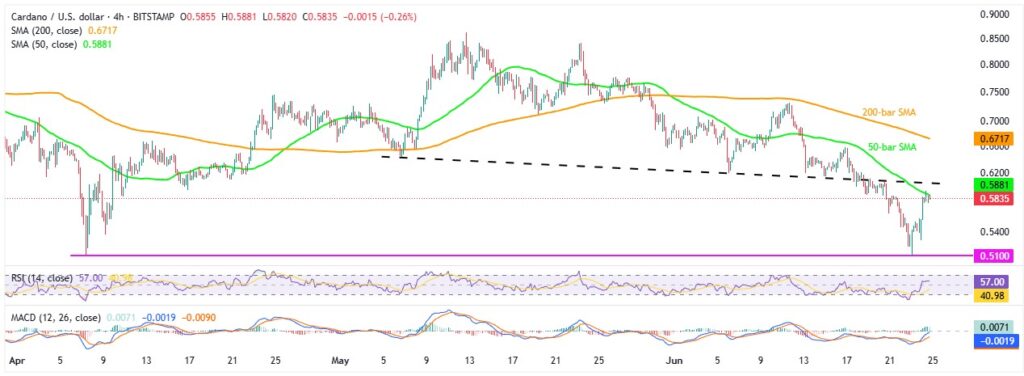
ADA/USD: Four-Hour chart points immediate test for buyers

Source: Tradingview
Unlike the daily chart, which offers room for further recovery, the four-hour chart of ADA/USD shows buyers battling the 50-bar Simple Moving Average (SMA) near $0.5885. Adding pressure is the early May support-turned-resistance around $0.6070.
However, the Relative Strength Index (RSI) holding above the 50.00 neutral level, along with bullish signals from the Moving Average Convergence Divergence (MACD) indicator, supports the ongoing recovery and raises hopes for a $0.6070 breakout. A successful move above that would shift focus to the 200-bar SMA near $0.6717, with further upside depending on the daily chart levels.
On the downside, immediate support appears at $0.5400, followed by the seven-month-old horizontal zone between $0.5200 and $0.5100. A deeper pullback could bring daily chart support levels back into play.
Overall, Cardano has momentum to challenge near-term resistance, but confirmation of a sustained bullish trend remains uncertain and needs a fundamental catalyst to convince buyers.


