- Cardano climbs to one-month peak, fueled by rising crypto market optimism and key technical breakout.
- Clear breakout past four-month resistance and 100-day SMA amid bullish MACD signals fuels ADA buying momentum.
- 200-day SMA could test ADA/USD bulls as RSI approaches overbought limit.
- Multiple challenges await ADA bulls, while bears are unlikely to reclaim control above $0.5100.
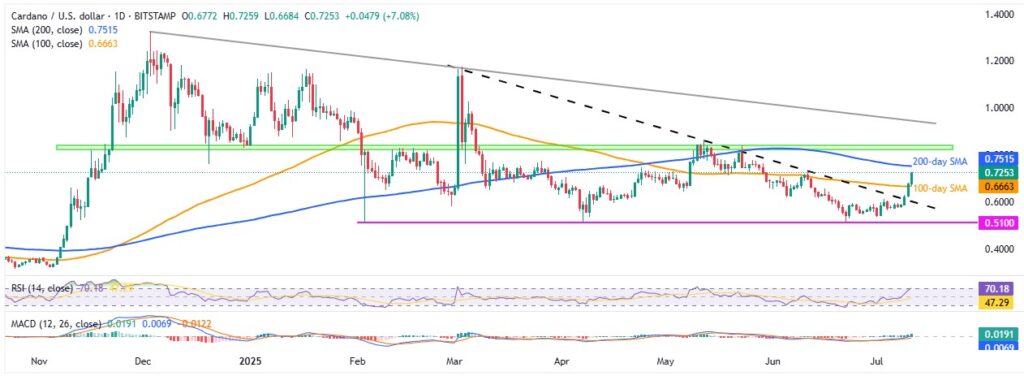
Cardano (ADA/USD) jumps to a one-month high, surging over 7.0% intraday to $0.7250 on Friday, fueled by broad crypto market optimism and a decisive technical breakout.
The successful breach of a four-month resistance line and the 100-day Simple Moving Average (SMA), combined with bullish Moving Average Convergence Divergence (MACD) signals, strongly favors the bulls. However, the 14-day Relative Strength Index (RSI) edges toward the overbought threshold near 70 as prices near the critical 200-day SMA, setting up a tense showdown between buyers and sellers.
ADA/USD: Daily chart shows multiple hurdles for bulls

If ADA bulls overcome the nearly overbought RSI and clear the 200-day SMA hurdle near $0.7515, they will face strong resistance between $0.8200 and $0.8450—a key horizontal zone since mid-November 2024.
Next, a downward-sloping resistance line from early December near $0.9475 stands as the last major hurdle before bulls aim for the $1.00 psychological level and the yearly high of around $1.1750 set in March.
On the downside, a pullback could find support at the 100-day SMA near $0.6663 and then at the former March resistance, now support, around $0.6000.
Multiple lows since February establish $0.5100 as a crucial support level defending the bears’ advance.
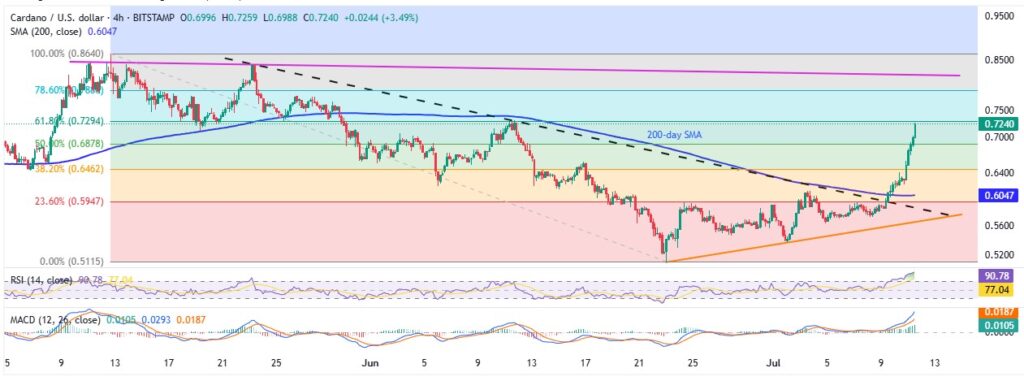
ADA/USD: Four-Hour chart highlights heated buying

Unlike the daily chart, the four-hour RSI dives deep into overbought territory, signaling intense buying pressure and a possible pullback at the first sign of weakness. This focuses attention on the key upside hurdle near $0.7300—the 61.8% Fibonacci Retracement of the May-June drop, known as the “Golden Ratio.” If bulls push past this, they’ll face a downward resistance line from May around $0.8210 before targeting higher technical levels highlighted on the daily chart.
On the downside, sellers might eye the 50% Fibonacci level near $0.6880 and the 200-bar Simple Moving Average (SMA) around $0.6050. Should bears maintain control, the former resistance turned support line from late May at $0.5870, followed by a rising trend line support at $0.5660, will serve as the last defensive barriers before prices revisit the daily chart support zones.
In summary, ADA/USD is poised to move higher, but the climb may be slow and choppy given multiple resistance levels and overbought RSI conditions.


