- Cardano price breaks two-week resistance with 3.0% intraday jump, but bulls still face strong challenges to reverse yearly loss.
- Recovery from key EMA supports and upbeat RSI bolster bullish bias.
- Multi-month resistances pose key test for ADA bulls eyeing yearly loss reversal.
- Short-term ADA upside looks supported, but reclaiming 2025 losses appears difficult.
Cardano (ADA) price jumped over 3.0% intraday while crossing a fortnight-old resistance heading into Thursday’s U.S. trading session, up for the second consecutive day at $0.7685 by the press time.
The quote’s latest run-up also fuels Cardano’s market cap to a week’s high of $27.07 billion, but the trading volume remains subdued at around $751.99 in the past 24 hours.
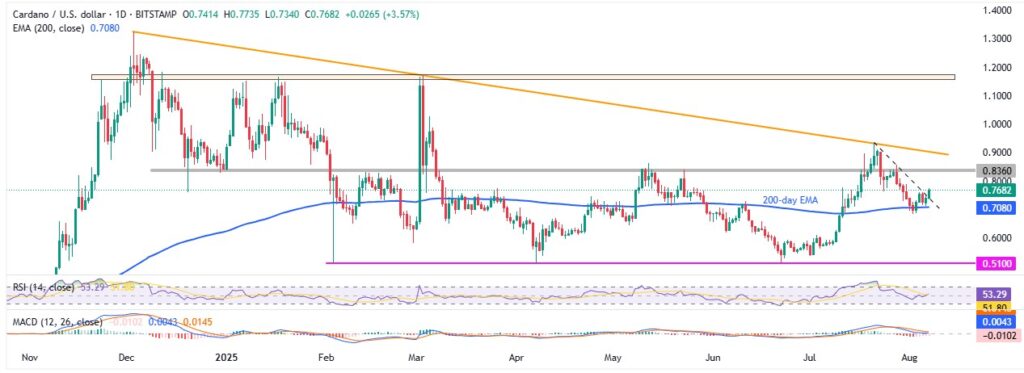
ADA’s run-up justifies its successful U-turn from the 200-day Exponential Moving Average (EMA), and upbeat conditions of the 14-day Relative Strength Index (RSI), suggesting extension of the latest rise.
However, multiple hurdles toward the north join sluggish signals from the Moving Average Convergence Divergence (MACD) indicator to challenge buyers targeting the reversal of a 9.0% yearly loss.
Cardano Price: Daily Chart Favors Short-Term Buyers

ADA confirms a short-term bullish bias with a clear U-turn from the 200-day EMA, the above 50.0 RSI line, and a successful break of a two-week-old resistance-turned-support around $0.7430.
That said, the Altcoin currently aims for a horizontal area comprising multiple levels marked since late December 2024, close to $0.8300-$0.8400, in an attempt to reverse the previous two-week downtrend.
However, an eight-month-long descending resistance line, surrounding $0.9050, acts as the final defense of the Cardano bears before allowing the traders to reverse the yearly loss. This highlights a broad horizontal area, including tops marked since November 2024, between $1.1550 and $1.1750.
On the flip side, ADA pullback may aim for the resistance-turned-support line near $0.7430 before revisiting the 200-day EMA support of $0.7080.
It’s worth noting, however, that the altcoin’s weakness past $0.7080 will make it vulnerable to retest the monthly low, currently around $0.6840. This in turn shifts the market’s focus to the early-June swing low near $0.6190, the $0.6000 threshold, and a six-month-old horizontal support surrounding $0.5100.
Cardano Price: Four-Hour Chart Highlights July’s Peak

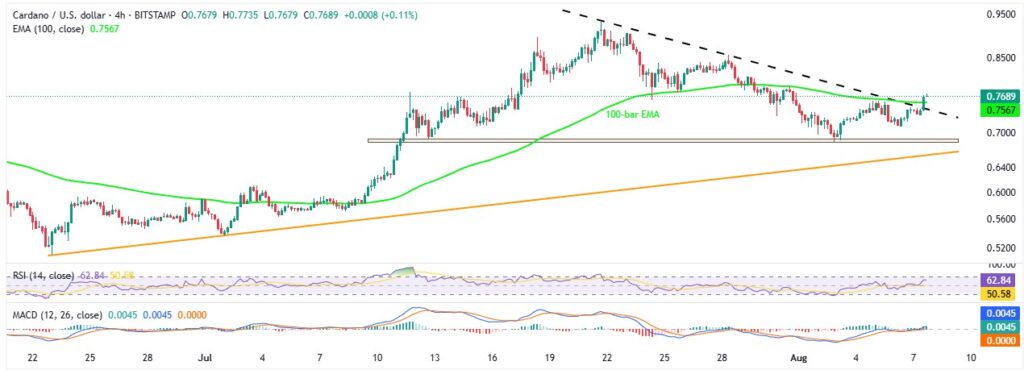
With a successful break of a two-week trend line and 100-bar EMA, backed by upbeat RSI and bullish MACD signals, the four-hour chart of the ADA appears more bullish than the daily outlook.
This suggests the quote’s quick run-up toward the previous monthly high of around $0.9340, with $0.7790 and $0.8540 acting as immediate resistances. Following that, higher levels discussed on the daily chart will be in the spotlight.
Alternatively, Cardano’s pullback may initially aim for the 100-bar EMA and the previous resistance line, respectively around $0.7560 and $0.7430, before approaching a four-week support zone surrounding $0.6890-$0.6840.
If ADA remains weak past $0.6840, an upward-sloping support line from late June, close to $0.6580, will act as the final defense of the buyers before highlighting the deeper levels mentioned on the daily chart.
Conclusion
Cardano’s rebound from the 200-day EMA, combined with a breakout above two-week resistance and strong momentum indicators, supports a near-term recovery of recent losses.
However, ADA remains down about 9.0% in 2025, and several upside hurdles still threaten efforts to flip the yearly losses.


