- Cardano price recovers from a multi-week low, snapping the three-day losing streak.
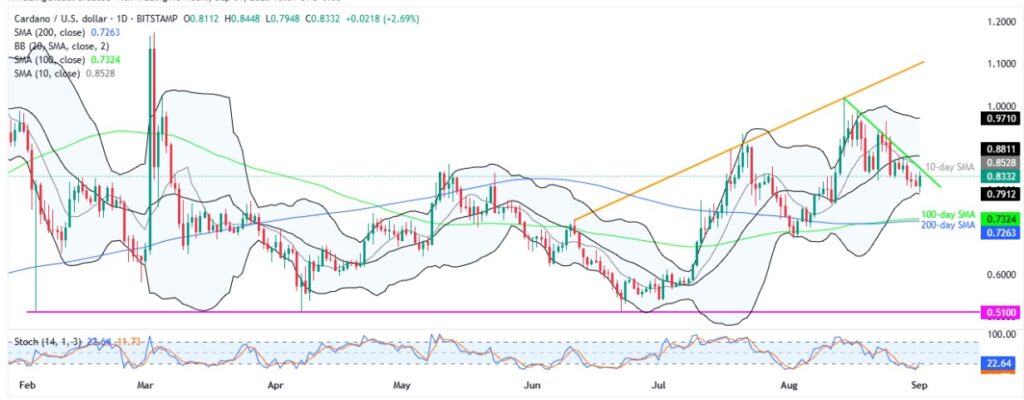
- ADA bounces off the Lower Bollinger Band amid oversold Stochastic, but faces resistance at the 10-day SMA and two-week trend line.
- Converging 100-day and 200-day SMAs also provide strong support against heavy downside.
- Short-term recovery appears imminent, but continuation of the two-month uptrend needs a strong catalyst.
Cardano (ADA) price rises over 2.0% intraday to $0.8330 during Monday’s European session as buyers return after a three-day absence.
ADA’s rebound from its lowest level since August 12 backed a technical support and overheated momentum indicator, namely the Stochastic, and a broader crypto market consolidation after a downbeat week.
The altcoin’s U-turn from the key technical support also benefits from an upbeat trading volume and a corresponding recovery in the market capitalization. That said, the ADA’s daily trading volume snaps a two-day losing streak while rising to $1.19 billion, and the market cap also improves from a three-week low to $29.98 billion, according to Santiment.
The recovery moves, however, need validation from a short-term resistance line and a Simple Moving Average (SMA) convergence to defend the previous two-month bullish trend. Even if the Cardano price drops, the key SMAs on the downside could stall the bears.
Currently, ADA is witnessing a short-term recovery, but its further upside hinges on the possibility of a resistance breakout. Meanwhile, the downside appears limited.
Cardano Price: Daily Chart Defends Recovery

The Stochastic momentum indicator’s U-turn from the 20.00 oversold limit joins the lower Bollinger Band (BB) to underpin the ADA’s latest recovery moves, helping buyers to battle with the $0.8550 resistance confluence, comprising the 10-day SMA and a two-week-old trend line resistance.
However, the quote’s upside past $0.8550 could help the traders reverse Cardano’s gradual fall since mid-August, highlighting the middle and upper BB, respectively, near $0.8820 and $0.9710, as the key resistance.
Beyond that, the $1.0000 psychological magnet and an ascending trend line from early June, close to $1.1020, will be on the bull’s radar.
Meanwhile, the ADA’s failure to cross the $0.8550 hurdle and a clear downside break of the lower BB support of $0.7910 could direct bears toward a convergence of the 100-day and 200-day SMAs, surrounding $0.7330-$0.7260.
Should Cardano bears keep the reins passed $0.7260, the odds of witnessing a gradual fall toward the previous monthly low of 0.6839 and then to a seven-month horizontal support around $0.5100 can’t be ruled out.
Cardano Price: Four-Hour Chart Highlights Short-Term Resistances

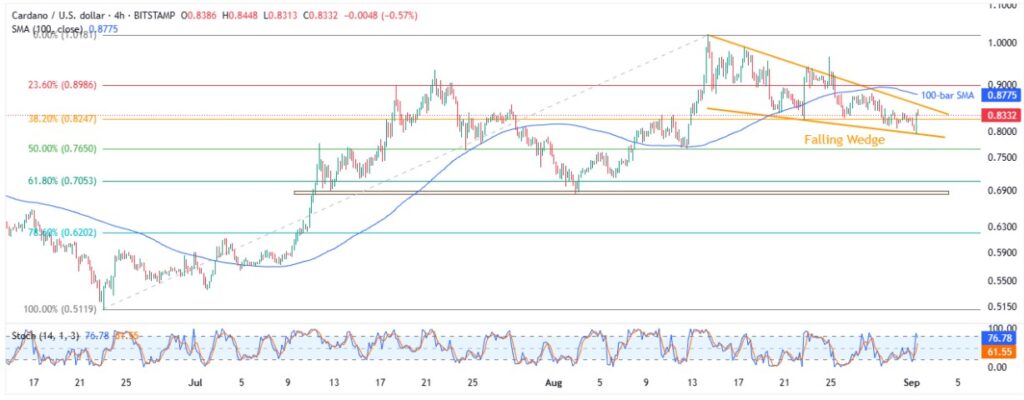
On the four-hour chart, Cardano displays a short-term “Falling Wedge” bullish chart formation, currently between 0.7960 and $0.8550, to lure buyers. However, the 100-bar SMA hurdle of $0.8775 can act as an extra upside filter to test the bulls past $0.8550 before giving them control.
In that case, the highest levels discussed on the daily chart and the wedge breakout’s theoretical target surrounding $1.0800 should gain attention.
Alternatively, a downside break of $0.7960 highlights the 50% and 61.8% Fibonacci retracement of the ADA’s June-August upside, near $0.7650 and $0.7050 in that order.
Still, a seven-week-old horizontal support area around $0.6870-$0.6840 acts as the final defense of the Cardano buyers.
Conclusion
Cardano’s recovery finds fuel from the lower Bollinger Band, an oversold Stochastic bounce, and market consolidation—boosting short-term upside hopes.
But with key resistance levels ahead, bulls need a strong catalyst to extend the two-month rally. That said, the ADA’s dip above $0.7260, however, may just be a healthy pullback.
Also read: Market Digest: Bitcoin Steadies at 109K as Trump’s Tariffs Weigh on Global Markets


