- Cardano price extends week-start rebound from 50-day SMA to pierce 200-day SMA.
- Convergence of short-term resistance line, 50-bar SMA challenges ADA bulls.
- RSI, MACD conditions favor gradual consolidation of the ADA/USD pair’s weekly losses.
- Reversal of the yearly loss remains elusive unless $0.9100 is cracked.
Cardano(ADA) price rises 2.0% intraday to $0.7400 heading into Monday’s U.S. session.
In doing so, ADA stretches the previous day’s recovery from the 50-day Simple Moving Average (SMA) to cross the 200-day SMA hurdle, following its two-week downtrend.
The ADA/USD pair’s latest recovery also traces an upward shift in the 14-day Relative Strength Index (RSI). Still, bearish signals from the Moving Average Convergence Divergence (MACD) indicator highlight a fortnight-long resistance line as the key hurdle for buyers in the short term.
Cardano Price: Daily Chart Signals Limited Upside Room

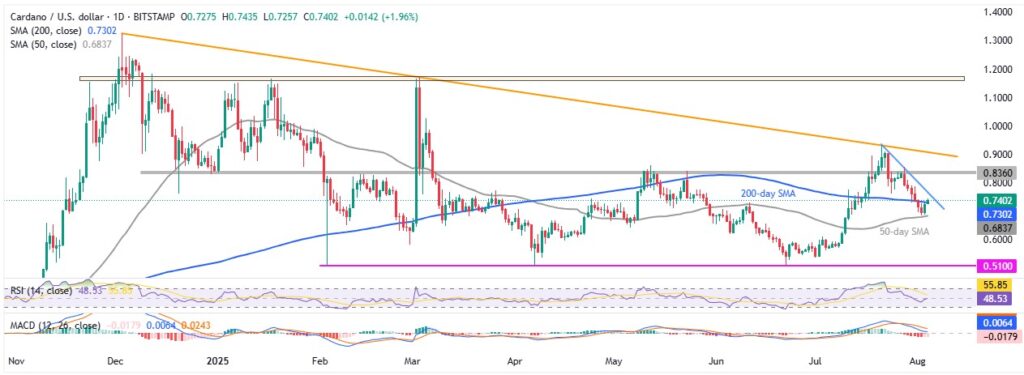
Cardano’s latest U-turn from the 50-day SMA gains support from the RSI line to cross the 200-day SMA. Still, a daily closing beyond the key SMA hurdle of $0.7300 becomes necessary to stay hopeful of confronting a two-week-old descending resistance line surrounding $0.7630.
If ADA buyers cross the $0.7630 resistance line, an area comprising levels marked since December 2024, close to $0.8350-$0.8360, will be in the spotlight.
Above all, the ADA/USD pair’s ability to reverse the yearly loss hinges on a clear break of the eight-month-old falling resistance line, close to $0.9100 at the latest.
On the contrary, ADA’s failure to offer a daily closing beyond $0.7300 can drag it back to the 50-day SMA support of $0.6837, a break of which could direct sellers toward an early July swing high surrounding $0.6100.
However, the quote’s sustained weakness past $0.6100 will make it vulnerable to revisit the previous monthly low of $0.5370 before confronting the key six-month horizontal support of around $0.5100.
Cardano Price: Four-Hour Chart Favors Gradual Run-Up

Consistent with the daily chart, the ADA/USD pair’s four-hour chart also suggests a gradual recovery, with multiple key resistances standing tall to challenge buyers.
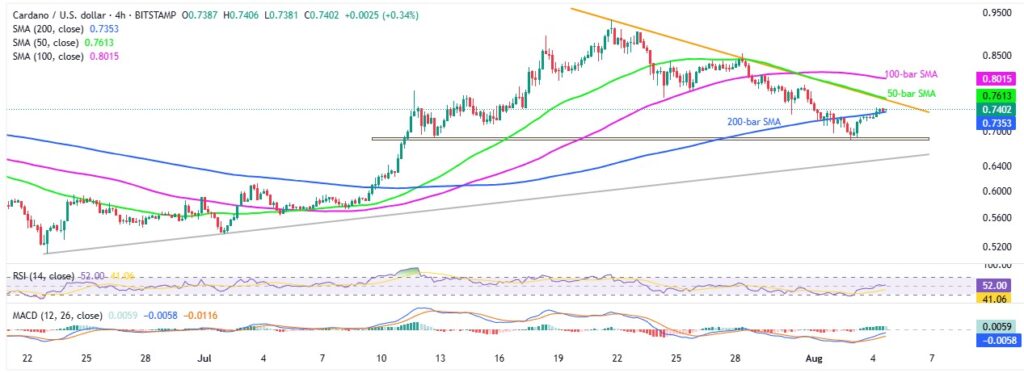
That said, Cardano currently crosses the 200-bar SMA hurdle of near $0.7355 backed by neutral RSI and bullish MACD signals, suggesting a continuation of the recovery.
Even so, the bulls need validation from a convergence of the short-term resistance line and 50-bar SMA confluence surrounding $0.7630 to retake control. Also acting as an upside filter is the 100-bar SMA of $0.8015; a break of the mentioned level could allow buyers to aim for the higher levels discussed on the daily chart.
Meanwhile, ADA’s daily closing beneath the 200-bar SMA of $0.7355 could drag the price back to a three-week-old horizontal support near $0.6860-$0.6850.
However, the quote’s further downside hinges on a clear break of a six-week-old ascending trend line support of near $0.6510, a breakout will highlight the daily chart supports.
Conclusion
Cardano (ADA) price may hold its latest rebound. However, it would be interesting to see how long it will take prices to cover the yearly losses.
Also read: Market Digest: Bitcoin Holds Near 114K as Tariffs, Weak Data Rattle Markets


