- Cardano price stays weak with sellers focused on seven-month triangle breakdown.
- Downbeat oscillators pose a challenge to ADA bears as they approach the horizontal support zone dating back to November 2024.
- Four-hour chart shows $0.6130 as additional support, ADA/USD rebound remains elusive below $0.8100.
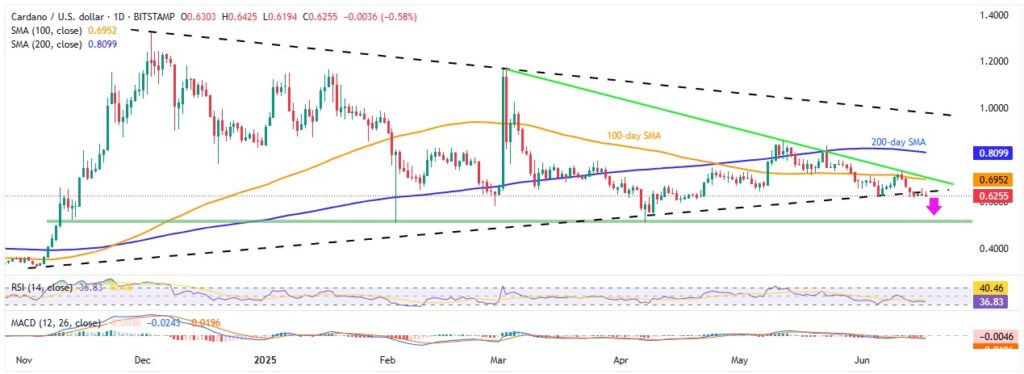
Cardano (ADA/USD) remains under pressure for a second straight day, posting mild losses around $0.6250 during Tuesday’s U.S. session. The latest weakness in the pair follows last week’s downside break of a seven-month-old symmetrical triangle pattern. However, fading bearish momentum and mixed fundamental cues have recently challenged ADA sellers, limiting further downside—at least for now.
ADA/USD: Daily chart cites risk of steeper south-run

Source: Tradingview
A sustained daily close below the ascending trendline from November—part of a long-standing symmetrical triangle—along with an early-month pullback from the 100-day Simple Moving Average (SMA), reinforces the bearish outlook for the ADA/USD pair. Bearish signals from the Moving Average Convergence and Divergence (MACD) indicator further support the negative bias.
However, the 14-day Relative Strength Index (RSI) hovers near the oversold threshold of 30.00, suggesting some hesitation among sellers. Still, this setup allows ADA bears to prepare for a potential drop toward a key horizontal support zone near $0.5200–$0.5100, which aligns with multiple lows recorded since November 2024.
Before that, the psychological level of $0.6000 and February’s bottom around $0.5800 may serve as intermediate support levels, acting as downside filters during the anticipated slide.
On the flip side, immediate recovery attempts are likely to be capped by the recently broken triangle support, now turned resistance, near $0.6430. A break above this level could initiate a corrective bounce, targeting the confluence of the 100-day SMA and a descending resistance line from March, located in the $0.6950–$0.6960 zone.
If buyers manage to push ADA/USD beyond $0.6960, attention would then shift to the 200-day SMA around $0.8100 and the triangle’s upper boundary near $0.9850—both key levels that would need to be cleared for a bullish reversal to gain traction.
ADA/USD: Four-Hour chart highlights additional support

Source: Tradingview
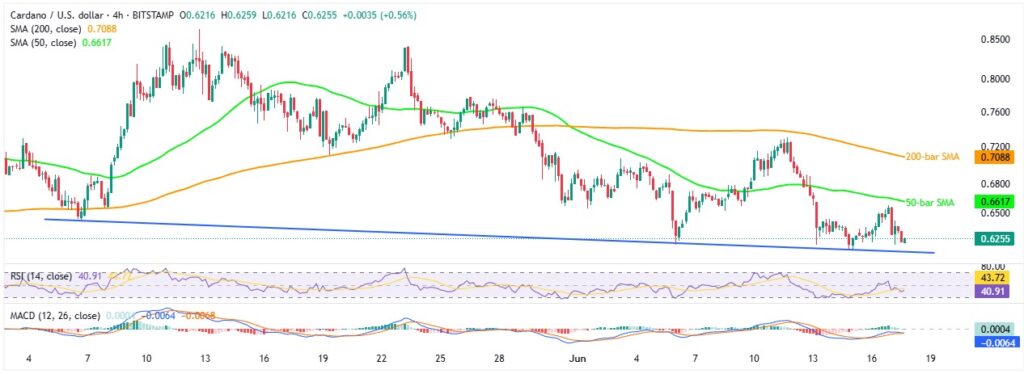
While the daily chart has already confirmed a bearish breakdown of the multi-month-old symmetrical triangle, the four-hour chart adds further downside confirmation, showing a descending trendline from early May near $0.6130. This level acts as an additional support filter before ADA/USD potentially heads toward the key horizontal support zone.
On the upside, short-term resistance is seen at the 50-bar and 200-bar SMAs, located around $0.6620 and $0.7090, respectively. These levels will be crucial for Cardano buyers to overcome, in addition to the resistance zones highlighted on the daily chart.
To sum up, Cardano appears well-positioned for a return to its multi-month-old support area, although the downward journey may be slow and gradual.


