- Cardano price faces a second rejection at the horizontal resistance from late 2024.
- Steady RSI and a weak MACD support ADA’s pullback, but short-term support line and key SMAs may limit further downside.
- Bulls need a breakout above $0.9000 to confirm a reversal of 2025 losses.
- Cardano is likely to stay within its multi-month range, signaling a near-term price pullback.
Cardano (ADA) price marks another failure to cross a multi-month horizontal resistance, falling over 1.0% to $0.7900 heading into Monday’s U.S. session.
The ADA pullback also takes clues from a three-day high trading volume, currently around $1.13 billion per Santiment, to lure sellers. That said, the Altcoin’s market cap also retreats from a two-week high marked during the weekend to $28.07 billion as we write.
Meanwhile, the 14-day Relative Strength Index (RSI) and the Moving Average Convergence Divergence (MACD) are trend-neutral.
Overall, Cardano remains locked in a five-month trading range, beyond the key Simple Moving Average (SMA), which in turn suggests limited bearish momentum.
Cardano Price: Daily Chart Signals Pullback

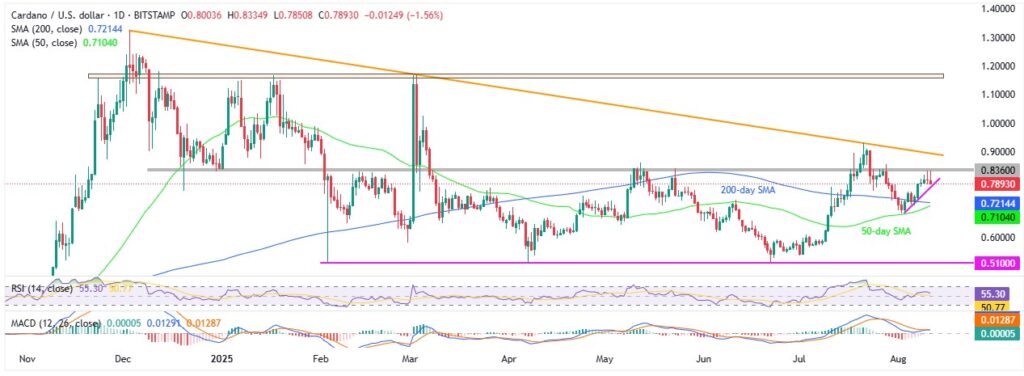
Cardano’s repeated failures to cross a horizontal resistance around $0.8300-$0.8400, comprising levels marked since December 2024, join a steady RSI and sluggish MACD signals to direct sellers towards a week-long support line near $0.7740.
However, the 200-day and 50-day SMAs, respectively near $0.7210 and $0.7100, followed by the monthly bottom around $0.6840, could challenge the bears afterward.
In a case where the ADA bears dominate past $0.6840, the late June swing low of $0.6190 and late February’s bottom of $0.5816 will be on their radar.
Above all, a five-month-old horizontal support surrounding $0.5100 will be the key watch for bears.
Alternatively, Cardano bulls must cross the $0.8410 upside hurdle on a daily closing basis to retake control. Even so, an eight-month descending trend line surrounding $0.9000 will be the last defense of the bears before giving control to the buyers.
In that case, July’s peak of $0.9340 and the $1.0000 psychological magnet will be in the spotlight.
Cardano Price: Four-Hour Chart Lures Sellers

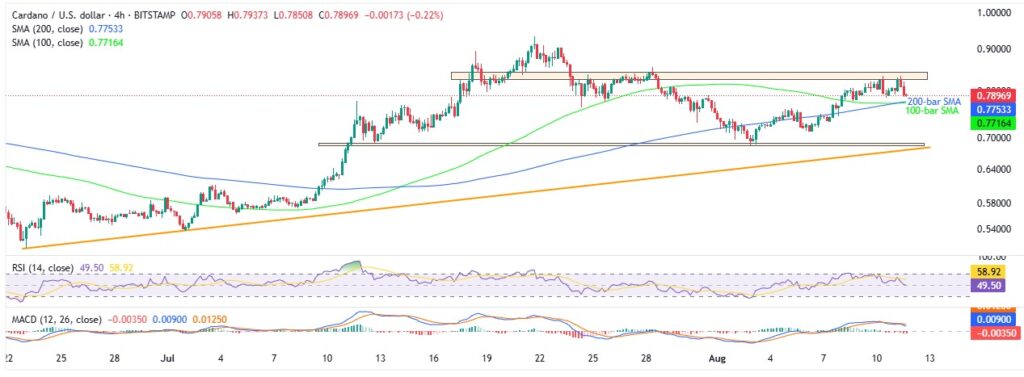
Cardano’s four-hour chart flashes short-term bearish signals, in line with the daily chart, as the prices pull back from a three-week-old horizontal resistance between $0.8250 and $0.8450.
The pullback traces the RSI’s retreat and bearish MACD signals to direct sellers toward a convergence of the 100-bar and 200-bar SMAs surrounding $0.7750-$0.7720.
Following that, a month-old horizontal support area will challenge the ADA bears around $0.6890-$0.6840. Also acting as the short-term key support is an upward-sloping trend line from late June, close to $0.6750 by the press time. Apart from that, the daily chart levels will be in the spotlight.
Alternatively, ADA’s clear break of $0.8450 hurdle will need validation from July’s peak of $0.9340 to convince buyers and aim for the higher levels discussed on the daily chart.
Conclusion
Cardano remains range-bound, with steady momentum indicators pointing to short-term downside, but a sharp drop seems unlikely.
Meanwhile, a clear breakout of the $0.9000 resistance, which is currently off the table, could trigger a strong upside move.
Also read: Ukraine’s Central Bank Governor Wants Crypto Legalization- But Draws a Red Line


