- Cardano price prints five-day losing streak on breaking 200-day SMA after stellar gains in July.
- RSI and MACD conditions suggest a gradual consolidation of monthly ADA gains.
- “Falling Wedge” on the four-hour chart might challenge immediate downside.
- Multiple supports make ADA/USD bear’s return difficult, even if they smash the key SMA support.
Cardano price (ADA/USD) slips over 1.70% intraday to $0.7250 as traders consolidate July’s heavy gains during early Friday. With this, the tenth-largest cryptocurrency by market capitalization parishes its July’s monthly gain of nearly 30.00%, the heaviest since November 2024, while falling for the fifth consecutive day to the lowest level since July 15.
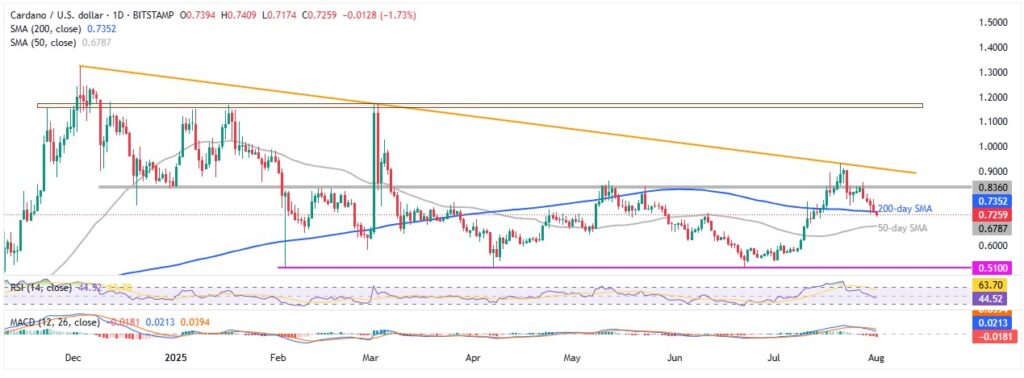
The ADA/USD pair’s latest fall justifies a downside break of the 200-day Simple Moving Average (SMA) and bearish conditions of the 14-day Relative Strength Index (RSI).
Apart from the 200-day SMA break and downbeat RSI, not oversold, the sluggish signals from the Moving Average Convergence Divergence (MACD) indicator also push back recovery hopes, especially when the ADA’s yearly loss is 6.0%.
Cardano: Daily Chart Dashes Recovery Hopes

Cardano sellers cheer a clear downside break of the 200-day SMA and a below 50.00 RSI line, not oversold, to keep the reins for the fifth consecutive day, hitting a two-week low. This joins with the downbeat MACD signals to suggest the quote’s further weakness toward the 50-day SMA surrounding $0.6785, with the $0.7000 threshold acting as an immediate support.
Meanwhile, ADA’s sustained downside break of the 50-day SMA could target multiple supports near $0.6250, $0.6100, and the $0.6000 threshold before directing bears to the yearly bottom of $0.5105, comprising lows marked since February.
Alternatively, a daily close beyond the 200-day SMA resistance, currently near $0.7355 at the time of press, will require validation from the July 24 swing low of around $0.7625 to suggest the ADA/USD pair’s further recovery toward the $0.8360-$0.8400 region, which comprises multiple levels marked since late 2024.
Should the ADA bulls manage to cross the $0.8400 hurdle, the $0.9000 threshold, and a downward-sloping resistance line from early December 2024, close to $0.9150 by the press time, will act as the final defense of the bears before suggesting a gradual rise toward an eight-month resistance area surrounding $1.1550-$1.1750.
Cardano: Four-Hour Chart Highlights “Falling Wedge”

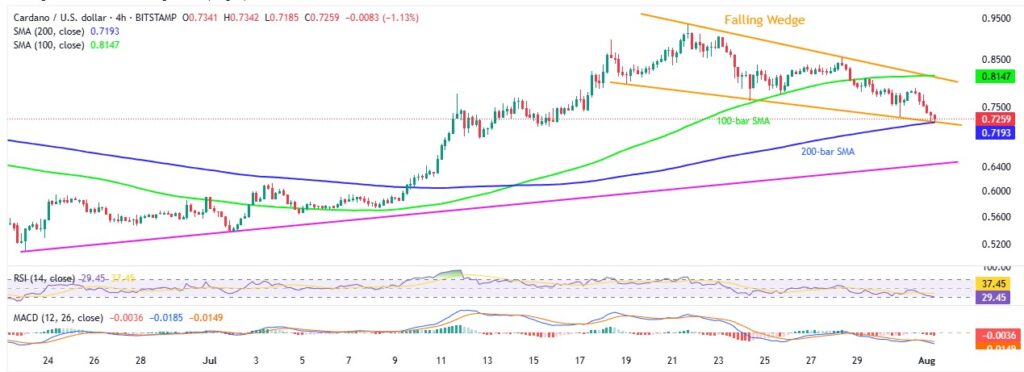
While a downside break of the 200-day SMA makes the daily chart interesting, a “falling wedge” bullish chart pattern on the four-hour projection gains the market’s attention.
That said, the bullish chart formation will need confirmation from the $0.8150 resistance to highlight the theoretical target at the $1.0300 level. Further, the 100-bar SMA adds strength to the $0.8150 resistance.
On the immediate basis, a convergence of the 200-bar SMA and the stated wedge’s bottom, close to $0.7190, restricts the short-term downside of the ADA/USD pair.
On the contrary, ADA’s break of $0.7190 can defy the bullish chart formation, but the sellers will have to crack an ascending support line from late June, close to $0.6410, to reverse July’s gains.
Overall, Cardano price appears primed for further downside, even if the south run is likely to be slow.
Also read: Market Digest: Bitcoin Slips to $115K as U.S. Tariffs Target Over 50 Nations


