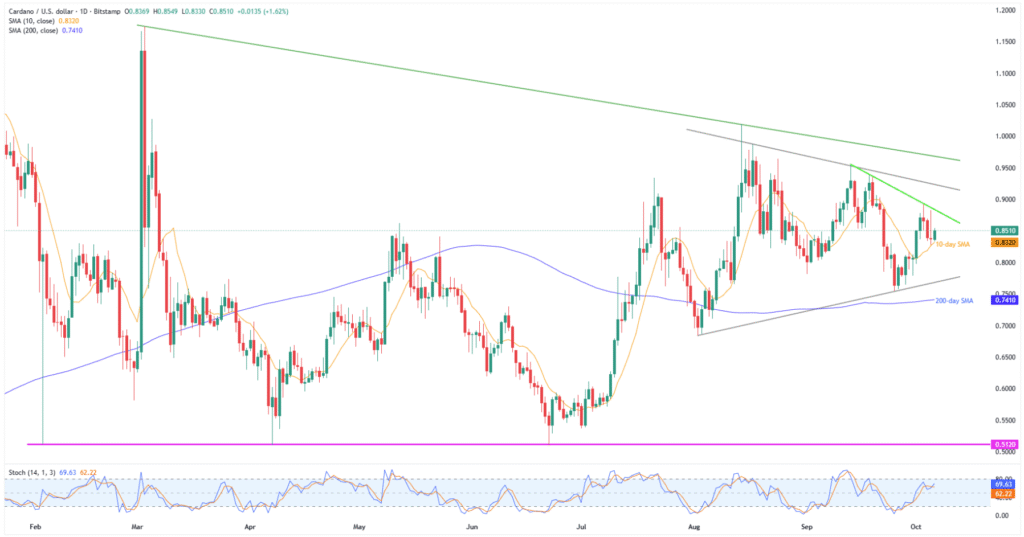
- Cardano price bounces off 10-day SMA, ending a three-day losing streak within a symmetrical triangle.
- Sustained trading beyond key SMAs, upbeat stochastic defends bullish bias.
- Three-week resistance line guards the immediate ADA upside inside triangle.
- A break above $0.9700 could extend ADA’s three-year uptrend, with the 200-day SMA acting as the key bear trigger.
Cardano (ADA) price posts the first daily gain in four while rising to $0.8500 early Monday morning in New York, up 2.0% intraday while recovering from the 10-day Simple Moving Average (SMA) within a two-month symmetrical triangle.
The altcoin’s latest rebound also justifies bullish signals from the Stochastic momentum indicator, as well as sustained trading beyond the 200-day SMA, amid broad crypto market optimism.
Also read: Walmart’s OnePay to Add Crypto Trading and Custody in Mainstream Push
Still, a pullback in trading volume, despite upbeat market capitalization (market cap), and a triangle formation, fuels the odds of a healthy consolidation in the Solana prices before the next rally. According to Santiment, Cardano’s daily trading volume retreats from an 11-day high to $1.13 billion, while the market cap hits a three-day high of $30.44 billion.
Meanwhile, the U.S. Dollar’s likely recovery on the potential U.S. government re-open, following a week-long shutdown, as well as mixed market sentiment, adds strength to the hopes of witnessing the ADA pullback.
With this, the risk of witnessing a short-term consolidation in Cardano price is high, but the broader bullish trend remains intact as long as the quote stays above $0.7410.
Cardano Price: Daily Chart Points To Trader’s Dilemma

Cardano’s sustained recovery from the 10-day SMA joins bullish Stochastic, above the neutral 50.00 but beneath the 80.00 overbought limit, to keep buyers hopeful.
This suggests the ADA’s further rise towards a three-week resistance line surrounding $0.8850.
However, a two-month-old symmetrical triangle formation, currently between $.9250 and $0.7680, could challenge the quote’s upside past $0.8850.
If not, then a descending resistance line from early March, close to $0.9700, will be the Cardano bear’s last line of defense, a break of which could propel prices toward the yearly peak of around $1.1750, with the $1.0000 psychological magnet likely acting as an intermediate halt.
On the flip side, the 10-day SMA support of $0.8320 restricts the ADA’s short-term declines before the stated triangle’s bottom surrounding $0.7680, with the $0.8000 threshold likely acting as an intermediate support.
Even if Cardano defies the triangle formation by falling beneath the $0.7680 support, the 200-day SMA level of $0.7410 will give the last fight to the bears before handing over control to them.
A clear break below $0.7410 could expose Cardano towards the $0.5100-$0.5120 support zone, which has held since February. In the process, the ADA bears may take a breather around the August monthly low of $0.6839 and the $0.6000 psychological magnet.
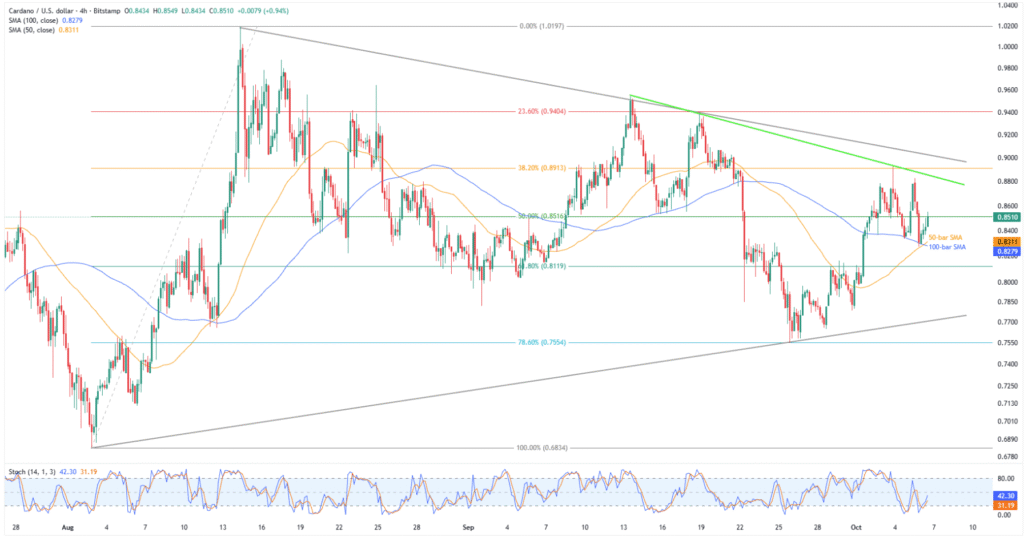
Cardano Price: Four-Hour Chart Defends Bullish Bias

Cardano’s four-hour chart also shows a bullish setup within a two-month symmetrical triangle, with the latest recovery from the key SMAs aligning with the Stochastic line’s U-turn from the oversold territory.
This highlights the 50-bar and 100-bar SMAs, respectively, near $0.8310 and $0.8280, as immediate supports, while a descending resistance line from mid-September, close to $0.8850, serves as additional trading filters, apart from what’s already discussed on the daily chart.
Conclusion
Cardano’s recovery from the key moving average suggests further advances in prices, with the potential short-term consolidation taking place within a two-month triangle formation. However, the altcoin’s three-year bullish trend holds, keeping buyers optimistic.


