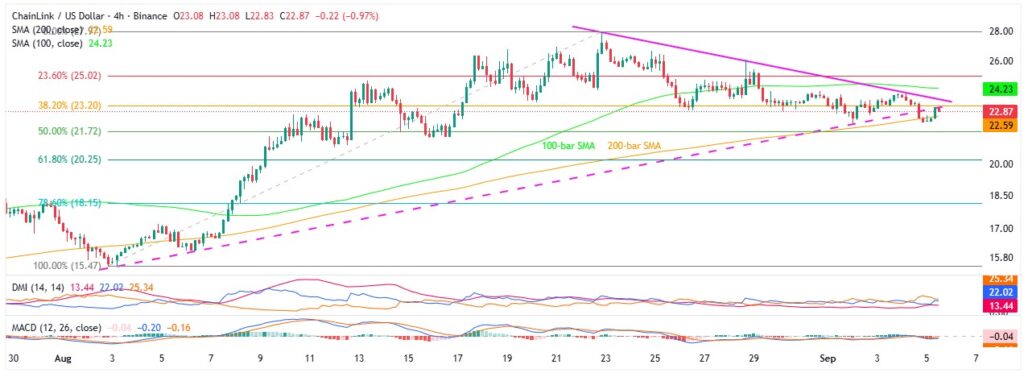
- Chainlink price recovers after triangle breakdown, trimming weekly loss ahead of key U.S. jobs data
- A clear downside break of the monthly triangle, bearish MACD signals, and sluggish DMI clues keep LINK sellers hopeful, unless the daily close is above $23.00.
- 21-day SMA may serve as a final defense for LINK bears, even if the corrective bounce persists.
- LINK’s short-term bearish bias gains acceptance, but a reversal of three-year gains remains unlikely.
Chainlink (LINK) price portrays the typical pre-data consolidation as it rebounds to $22.90 early Friday, up nearly 3.00% intraday after posting the biggest daily fall in a week.
LINK’s latest rebound could be traced to the market’s positioning for the monthly U.S. employment data for August, as well as a pullback in the U.S. Dollar.
Also read: Market Digest: Bitcoin Dips to 110K as Fed Cut Bets Build Despite Trump–Russia Clash
Despite the corrective bounce, Thursday’s clear breakdown of the month-old symmetrical triangle, combined with bearish signals from the Moving Average Convergence Divergence (MACD) and Directional Movement Index (DMI) momentum indicators, keeps Chainlink sellers hopeful.
Notably, upbeat trading volume and a rebound in market capitalization reinforce the bearish bias on LINK, indicating strong market participation behind the breakdown. The altcoin’s daily trading volume has risen for the second straight day to $982.03 million, while its market cap recovered to $15.64 billion after hitting a three-week low, according to Santiment.
Even if the triangle breakdown teased short-term sellers, multiple key support levels and strong fundamentals underpin Chainlink’s broader bullish outlook.
Chainlink Price: Daily Chart Points To Gradual Short-Term Weakness

Chainlink’s latest rebound gains little credence unless reversing the triangle breakdown with a daily closing beyond $23.00. Also keeping the sellers hopeful is the quote’s sustained trading beneath the 21-day Simple Moving Average (SMA) and a descending trend line from late August, forming part of the triangle.
Bearish MACD signals support LINK’s downside bias, while the Directional Movement Index (DMI) shows a neutral momentum bias. That said, the Average Directional Index (ADX line in red) hovers near the neutral 25.00 mark, and both the Upmove (D+ in blue) and Downmove (D- in orange) lines fluctuate around 20.00.
Even if the quote manages to offer a daily close past $23.00 and challenges the triangle breakdown, a descending resistance line from August 22, close to $23.60, will precede the 21-day SMA hurdle of $24.27 to challenge short-term LINK recovery.
Beyond that, LINK bulls may encounter the $26.50 hurdle before facing the broader resistance zone between $27.20 and $27.90, which comprises the tops from January and August.
Should Chainlink remain firmer past $27.90, also cross the $28.00 threshold, the buyers can aim for the late 2024 peak of $30.95, with the $30.00 round-figure likely acting as an intermediate hurdle.
Meanwhile, LINK’s daily closing beneath the $23.00 support-turned-resistance can drag it back to the weekly low near $22.10 and then to the 50-day SMA support of $21.20.
However, the ascending trendline from February — now acting as support near $20.50 — is in focus, as a clear break below it could threaten LINK’s three-year uptrend, exposing the 200-day SMA at $16.11 and possibly the yearly low at $10.12.
Chainlink Price: Four-Hour Chart Highlights Triangle Breakdown

Chainlink’s struggle to reverse the triangle breakdown appears clearly visible on the four-hour (4H) chart, with the prices currently jostling with the bottom line surrounding $23.00.
It’s worth noting that the MACD signals remain bearish on the 4H, but the DMI turns more bearish with the Downmove (D- in orange) line edging higher past the 25.00 neutral level, whereas the Upmove line (D+ in blue) stays beneath the D-, and the ADX is at the lowest point.
With this, the LINK price is expected to drop back to the latest trough surrounding $22.20, with the 200-bar SMA near $22.60 acting as immediate support.
Meanwhile, $21.30 and $20.80 can act as additional downside filters before directing the quote to the 61.8% and 78.6% Fibonacci retracements of its August upside, respectively near $20.25 and $18.15. Beneath that, the deeper levels discussed on the daily chart will be in the spotlight.
Alternatively, a clear breakout of $23.00, will aim for the stated triangle’s top surrounding $23.60 and then the 100-bar SMA hurdle of $24.23 ahead of targeting the higher daily chart levels.
Conclusion
Chainlink’s (LINK) latest recovery gains little credence from technical levels and momentum indicators, despite cautious optimism among the crypto traders.
Hence, a daily close above $23.00 is crucial to witness further gains toward multi-month resistance and yearly highs.
Otherwise, a short-term pullback, which is seen as more likely, may occur. Still, buyers are expected to stay in control on a longer-term basis.
For more cryptocurrency news, check out our Crypto Bytes.


