- Chainlink price retreats from a seven-month-high, snaps a three-day rise, and falls 5% intraday ahead of key U.S. data and events.
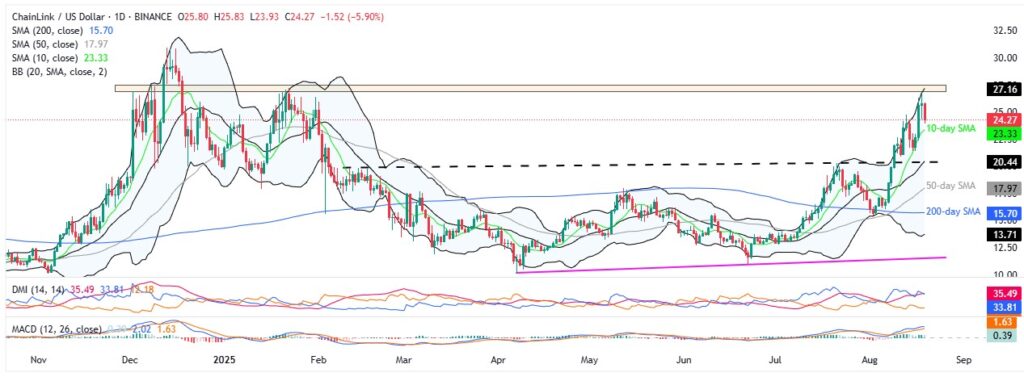
- Pullback from the upper Bollinger Band (BB), accompanied by strong DMI and MACD signals, suggests healthy consolidation.
- LINK bears hinge on six-month resistance-turned-support and middle BB, while fresh upside stays capped below $27.50.
- Chainlink’s short-term pullback seems possible, but the overall bullish trend remains intact.
Chainlink’s (LINK) price snapped a three-day winning streak early Tuesday, retreating from a seven-month high to $24.27, and posting over 5% intraday loss by press time.
The LINK’s latest fall could be tied to the previous day’s U-turn from an upper Bollinger Band (BB), close to a multi-month resistance area, as traders gear up for top-tier U.S. data and events this week.
Also read:
Monday’s pullback also gained strength from the highest trading volume since December 2024, which eased slightly to $2.93 billion on Tuesday, according to Santiment. That said, the LINK’s market cap also softened from an eight-month high to $16.54 billion at the latest.
It should be noted that Chainlink remains above important support levels, and momentum indicators, such as the Directional Movement Index (DMI) and the Moving Average Convergence Divergence (MACD), remain bullish. The current price weakness can be seen as a healthy consolidation rather than reversing its two-month uptrend.
Chainlink Price: Daily Chart Points To Challenges for Bears

Chainlink’s pullback from the upper BB approaches the 10-day Simple Moving Average (SMA) support of $23.33, but the bullish momentum indicators and multiple supports toward the south keep sellers on edge.
That said, the DMI and MACD continue to support bullish momentum. That said, the DMI’s Upmove line (blue), or D+, holds above the neutral 25.00 level, and the Average Directional Index (ADX) line (red) stays near 35.00, making it harder for sellers to gain control.
On the same line, the bullish MACD signals (green) also suggest the upside momentum.
Should LINK price break the $23.33 SMA support, lows marked during the last week around $21.40 and $20.85 could test the bears before directing them to the key $20.50 support confluence, comprising the middle BB and previous resistance line from February.
If the altcoin remains weak past $20.50, the $20.00 threshold could act as an additional downside filter before highlighting the 50-day and 200-day SMAs for bears, close to $17.98 and $15.70, respectively. It’s worth mentioning that the lower BB could restrict the LINK’s further downside near $13.70.
Alternatively, an area comprising multiple tops marked since December 2024 and the upper BB, near $26.90-$27.50, appears a tough nut to crack for Chainlink buyers.
Following that, the $28.50 and the $30.00 round figures might test the LINK bulls ahead of the 2024 peak of $30.95.
Chainlink Price: Four-Hour Chart Highlights Rising Wedge

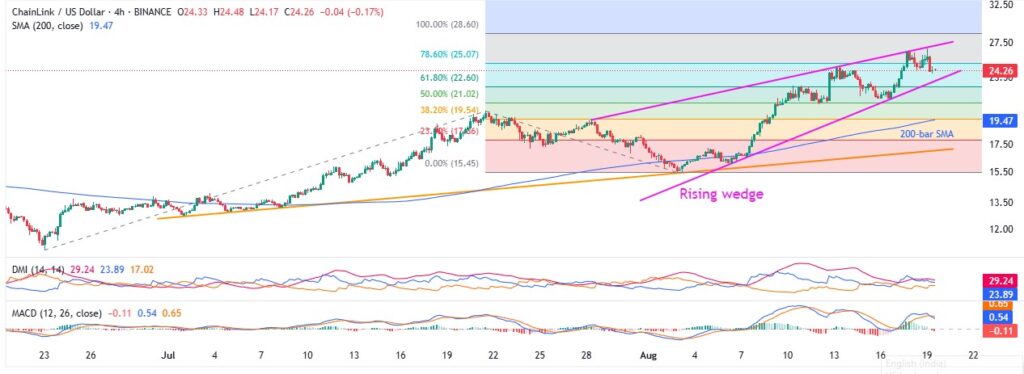
Chainlink’s four-hour chart appears slightly less bullish as it portrays a three-week-old “rising wedge” bearish formation. Also keeping short-term sellers hopeful is the DMI indicator, wherein the Upmove (D+, Blue) line is slightly below the 25.00 threshold. Still, the ADX line remains firmer around 29.00. Meanwhile, the MACD signals are bearish and suggest the downside momentum.
Even so, a clear downside break of $23.20 becomes necessary to confirm the “Rising Wedge” with a theoretical target of $12.00. During the fall, the 200-bar SMA of $19.47 and a seven-week-old rising trend line, near $17.00, along with the daily chart levels, could act as intermediate supports to watch for the LINK bears.
Alternatively, an upside clearance of $27.10 will defy the rising wedge formation, but will need validation from the $27.50 hurdle, discussed in the daily chart, to convince Chainlink buyers.
That said, the 78.6% and 100% Fibonacci Extensions (FE) of the LINK’s June-August moves, near $25.10 and $28.60, respectively, can act as additional resistance levels to watch for the bulls.
Conclusion
Chainlink’s inability to clear key resistance and retreat from the upper Bollinger Band (BB), combined with weakening short-term momentum signals, could attract short-term selling. However, the bullish trend stays intact unless the price closes below the $20.50 support confluence on the daily timeframe.
Also read: Market Digest: Bitcoin Slips to 115K as Trump–Zelenskyy Talks Stir Uncertainty


