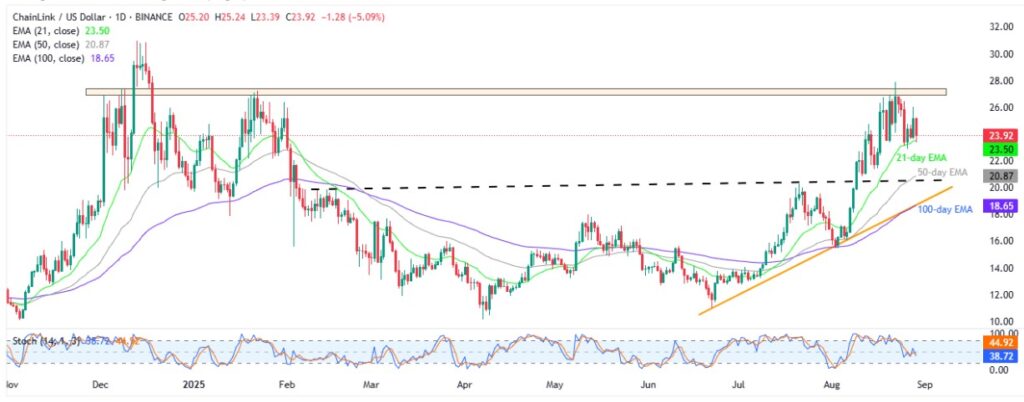
- Chainlink price again retreats toward 21-day EMA, keeping last week’s pullback from a multi-month horizontal resistance zone.
- Downbeat Stochastic, steady trading above key EMAs, and an eight-week bullish megaphone pattern keep LINK buyers cautiously optimistic.
- The 21-day EMA and multi-month previous resistance can test sellers before the $18.60 support level, while Chainlink’s recovery remains elusive below $27.50.
- A broader bullish trend is likely to remain intact, despite potential intermediate pullbacks.
Chainlink (LINK) price drops back to $23.80, down over 5.0% intraday while reversing the early-week rebound from the 21-day Exponential Moving Average (EMA), as sellers brace for a weekly loss early Friday.
In doing so, the altcoin flips yesterday’s rebound, but posts a third bounce from the 21-day EMA, as well as a fortnight-old support line, while keeping last week’s pullback from a multi-month horizontal resistance.
LINK’s pullback gains support from strong trading volume, even if the downbeat conditions of the Stochastic momentum indicator and a pullback in the market capitalization test the sellers.
That said, Chainlink’s daily trading volume jumps to a one-week high of $2.67 billion, while the market cap eases to $23.99 billion, according to data from Santiment.
Additionally, multiple upside hurdles, ranging from December 2024 to an eight-week-old “Bullish Megaphone” trend broadening chart formation, favor hopes of witnessing further weakness in prices, while maintaining a broad bullish outlook intact.
Chainlink Price: Daily Chart Points To Gradual Recovery

Chainlink’s repeated rebound from the 21-day EMA and the Stochastic momentum indicator’s condition below 50.00 challenge the sellers, unless the quote offers a clear break below the immediate EMA support of $23.50. Otherwise, another recovery could aim for the $25.00 and $26.00 thresholds.
Still, a horizontal area ranging from December 2024, close to $26.90-$27.50, appears to be a tough nut to crack for Chainlink buyers. Also acting as an upside filter is the monthly high surrounding $27.90 and the $28.00 round figure.
Beyond that, LINK buyers can aim for the late 2024 peak of $30.95.
On the flip side, Chainlink sellers need a daily closing beneath the 21-day EMA support of $23.50 to retake control and aim for the mid-August swing low around $21.40.
Following that, the 50-day EMA support of $20.85 and a horizontal line from February, previous resistance around $20.50, will precede the $20.00 round figure and a two-month rising support line, as well as the 100-day EMA near $18.60, to challenge the LINK bears.
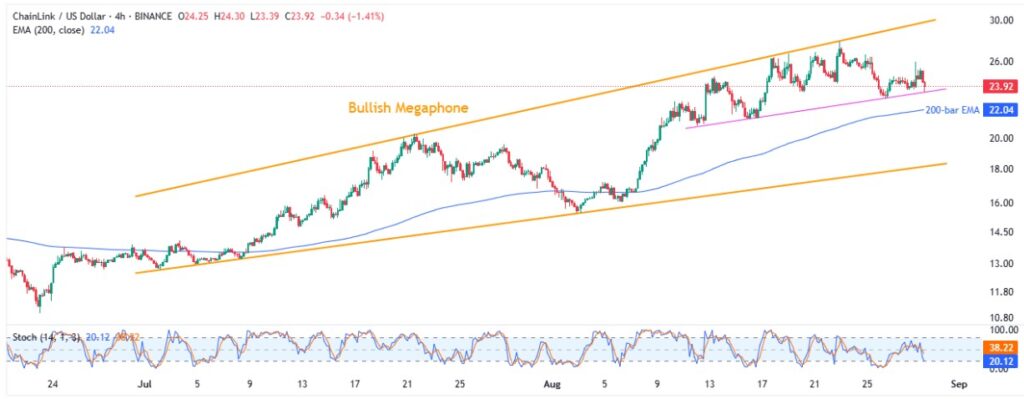
Chainlink Price: Four-Hour Chart Highlights Bullish Megaphone

Chainlink seesaws near the upper boundary of an eight-week-old bullish megaphone trend-broadening pattern, bouncing off a two-week ascending support line of late.
With the downbeat Stochastic below the 50.00 neutral level, the LINK’s latest weakness is likely to fade around the $23.50 trend line, if not then a quick fall toward the $23.00 round figure can’t be ruled out.
Below that, the 200-bar EMA of $22.00 and July’s peak of $20.25 could test Chainlink sellers ahead of highlighting the stated megaphone’s lower boundary, close to $18.10.
It’s worth noting, however, that LINK’s downside break of $18.00 makes it vulnerable to slump toward the monthly low of $15.45.
Alternatively, the $26.00 round figure guards immediate recovery moves of the LINK.
After that, the stated wedge’s upper boundary, close to $29.75, will act as the final defense of the LINK sellers before directing prices toward the higher levels discussed on the daily chart.
Conclusion
Chainlink (LINK) seems to be in a consolidation mode amid multiple failure to stay past the 21-day EMA, as well as due to sluggish Stochastic line and trend-broadening chart pattern.
While a short-term LINK pullback remains possible due to the nearby resistances, the broader bullish outlook stays intact.
That said, LINK’s sustained rise past $27.50 could allow bulls to aim for the 2024 top, whereas sellers need a clear break of $23.50 to gain control, even for the short term.
Also read: Market Digest: Bitcoin Holds at $112K as Wall Street Rallies on Economic Recovery


