- Chainlink price surges to highest since February, up for the second consecutive day.
- LINK buyers gain momentum as key resistance breakouts, a “Golden Cross,” and bullish MACD signals.
- Overbought RSI and a multi-month horizontal resistance near $27.00 pose a major challenge for LINK bulls.
- Chainlink remains in bullish trend, even as short-term consolidation looks overdue.
Chainlink (LINK) price rises to a six-month high near $24.75 ahead of Wednesday’s U.S. session, up 1.0% intraday around $23.85 at press time.
Tuesday’s breakout of a two-month ascending trendline resistance, last week’s bullish moving average crossover, and bullish signals from the Moving Average Convergence Divergence (MACD) indicator all fuel the LINK’s latest rally.
Adding strength to the upside bias is an eight-month high trading volume of $2.90 billion, according to Santiment, and the largest market cap since late January, close to $16.38 billion at the latest.
Still, overbought conditions of the 14-day Relative Strength Index (RSI) and proximity to a multi-month resistance zone could challenge the Chainlink buyers.
Chainlink Price: Daily Chart Signals Limited Upside Room

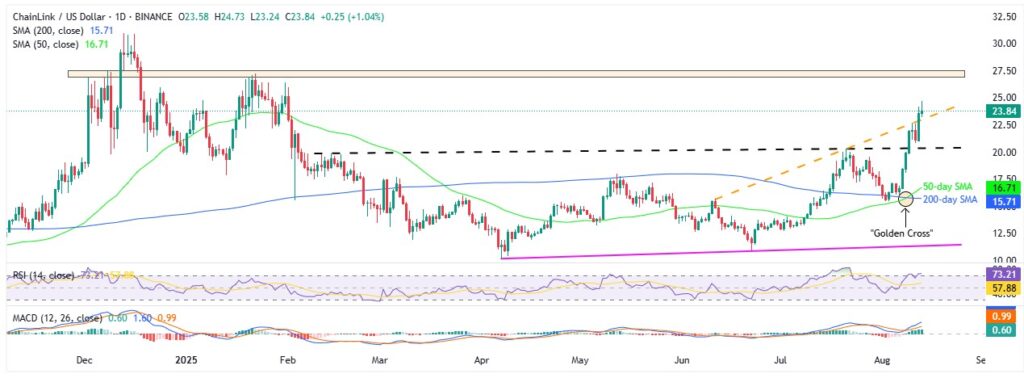
The successful upside break of ascending resistance lines from early February and June joins bullish MACD signals to underpin the Chainlink buyer’s optimism.
Last week’s “Golden Cross”, a classic bullish moving average crossover signal when the 50-day Simple Moving Average (SMA) pierces the 200-day SMA from below, also keeps the Chainlink buyers hopeful.
With this, the LINK price is likely to extend the latest run-up toward a horizontal area ranging from December 01, 2024, surrounding $26.90-$27.50. However, the overbought RSI conditions could challenge the quote’s further upside.
If not, then the late 2024 peak near $30.95 could lure buyers.
Alternatively, Chainlink pullback remains elusive beyond the resistance-turned-support line from June, close to $23.00 at the latest.
Following that, a slightly upward-slanting trend line from February, close to $20.40, quickly followed by the $20.00 psychological magnet, will challenge the LINK bears.
Should the prices remain weak past $20.00, May’s high of $17.97, the 50-day SMA of $16.71, and the 200-day SMA surrounding $15.71 will be in the spotlight.
Chainlink Price: Four-Hour Chart Highlights Channel Formation

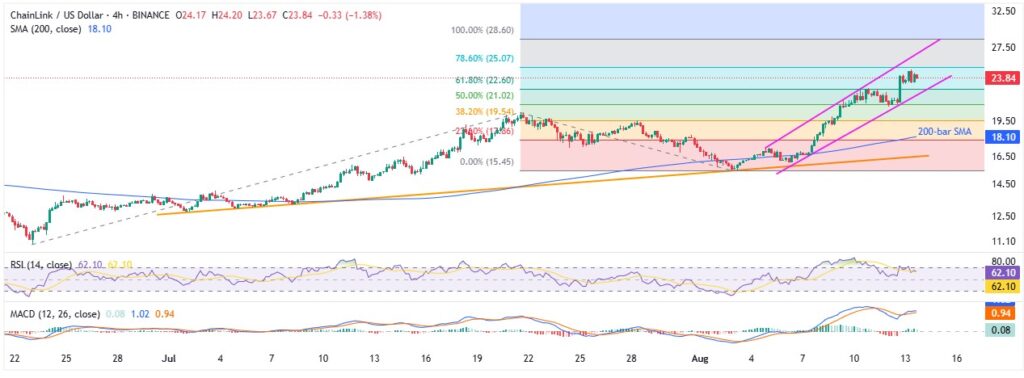
A week-long ascending trend channel between $22.00 and $26.80 joins upbeat but not overbought RSI and the bullish MACD signals to defend the LINK buyers on the four-hour chart.
The 200-bar SMA support of $18.10 and a rising trend line from early July, near $16.50, also acts as short-term trading filters.
Meanwhile, an upside break of $26.80 could test the $26.90-$27.00 resistance zone, mentioned on the daily chart, before the 100.00% Fibonacci Extension (FE) of Chainlink’s June-August moves, near $28.60.
Conclusion
Chainlink’s successful breakout of multi-month resistances, bullish MACD signals, and a “Golden Cross” point to a further upside potential of the altcoin. However, the 14-day RSI is in overbought territory, and hence the LINK’s rally may slow. As a result, traders should watch for healthy consolidation before the next leg higher.
Also read: NYSE’s Parent Company and Chainlink Team Up to Bring Forex, Precious Metals Data On-Chain


