- Chainlink price stays firmer at one-week high, after confirming a bullish chart pattern earlier this week.
- LINK buyers remain optimistic as price holds above key EMA and bullish Stochastic supports the “Falling Wedge” breakout.
- Multi-month resistance zone aligns with the Falling Wedge pattern’s target to highlight $28.00 for Chainlink bulls.
- LINK bulls eye fresh yearly high, but face strong resistance and potential pullbacks ahead of the Fed rate decision.
Chainlink (LINK) posts 1.0% intraday gains around $23.80, keeping the early-week bullish breakout at a one-week-high, as market players brace for the key U.S. inflation data on Thursday.
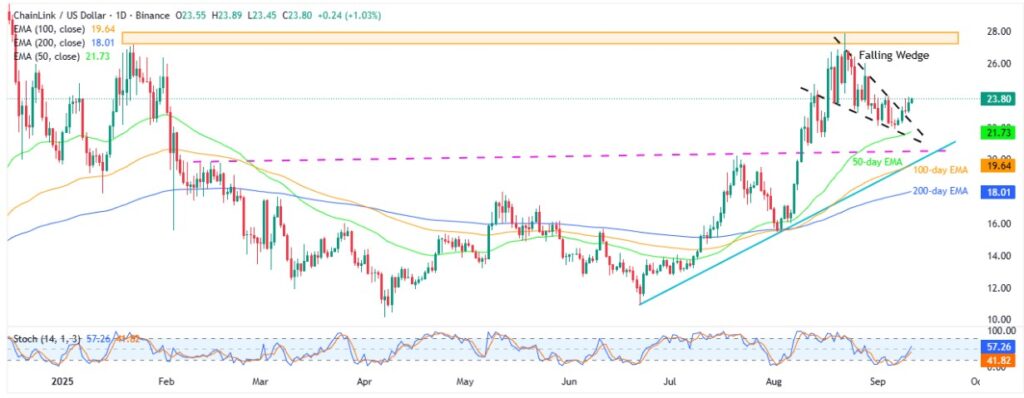
The altcoin confirmed a three-week “Falling Wedge” bullish chart formation on Tuesday, backed by sustained trading beyond key Exponential Moving Averages (EMAs) and bullish conditions of the Stochastic momentum indicator.
However, a cautious mood ahead of today’s U.S. Consumer Price Index (CPI) and the next week’s Federal Reserve (Fed) Interest Rate Decision seems to test the LINK buyers at a one-week-high.
Meanwhile, trading volume also eases for the second consecutive day, even as the market capitalization (market cap) jumps to a fortnightly high, suggesting the market’s consolidation before the key data/events. That said, LINK’s daily trading volume eases for the second straight day to $784.67 million, while its market cap rises to the highest since August 29, to $16.13 billion, according to Santiment.
With this, Chainlink price is likely to stay firmer, extending its monthly and yearly gains, despite the latest inaction ahead of the key catalysts.
Chainlink Price: Daily Chart Keeps Buyers Hopeful

Chainlink’s confirmation of a month-long falling wedge bullish chart pattern highlights $28.00 as the theoretical target for the buyers.
Adding strength to the LINK’s upside bias is the quote’s sustained trading beyond the key EMAs, the August breakout of a multi-month resistance line, and upbeat Stochastic conditions.
Notably, multiple hurdles near the $24.00 and the $25.00 thresholds could test Chainlink buyers before a horizontal area from late January, between $27.20 and $28.00, which also aligns with the falling wedge’s theoretical target, could challenge the quote’s further upside.
In a case where LINK remains firmer past $28.00, the buyers can aim for the late 2024 peak of $30.95, with the $30.00 round-figure likely acting as an intermediate hurdle.
Meanwhile, LINK’s daily closing beneath the $22.50 support-turned-resistance can drag it to the 50-day EMA support of $21.70.
However, the ascending trendline from February, now acting as support near $20.50, will precede a convergence of the 100-day EMA and an ascending trend line from late June, close to $19.60, as well as the 200-day EMA level of $18.00, to offer strong downside supports past $21.70.
Should Chainlink bears keep the reins past $18.00, the previous monthly low around $15.45 and the yearly bottom of $10.12 will gain the market’s attention.
Chainlink Price: Four-Hour Chart Highlights Weekly Recovery

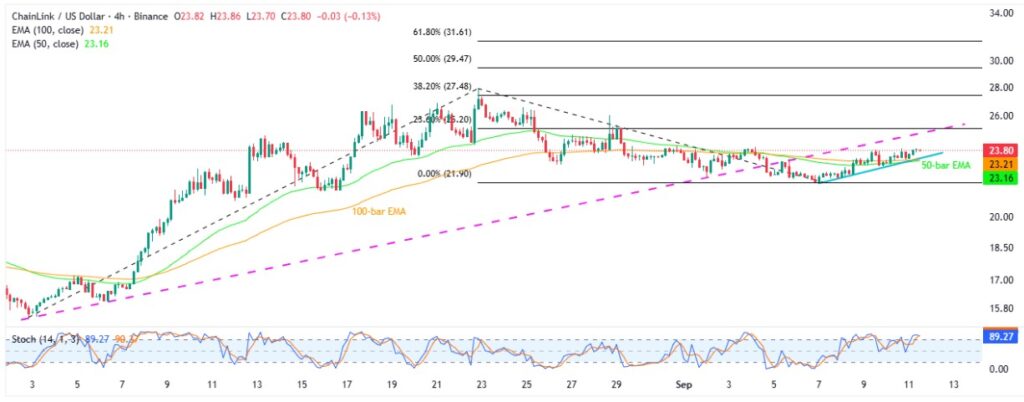
On the four-hour chart, LINK portrays a weekly recovery after a two-week downtrend, recently staying firmer past the 50-bar and 100-bar EMAs to reverse the early-month bearish break of an ascending trend line from August 02.
This highlights $24.80 as an immediate upside hurdle, a break of which could shift the buyer’s attention to the 38.2%, 50%, and 61.8% Fibonacci Extensions of Chainlink’s August-September moves, near $27.50, $29.50, and $31.60 in that order.
Meanwhile, the weekly support line joins the 50-bar and 100-bar EMAs to highlight $23.30-$23.20 area as the short-term key support zone to watch for the sellers during the LINK’s fresh fall.
Below that, the monthly low of $21.91 and the deeper levels discussed on the daily chart will gain the market’s attention.
Conclusion
Chainlink’s latest inaction justifies the market’s cautious mood ahead of the key macro catalysts.
Still, the quote defends its bullish breakout and stays beyond the key EMAs, backed by upbeat momentum.
This keeps the LINK buyers hopeful of challenging the yearly top, even as the market’s positioning for key catalysts might offer intermediate halts during the potential rally.
For more cryptocurrency news, check out our Coin Bytes.


