- Chainlink price stalls a three-day winning streak after jumping the most in a week the previous day.
- 200-day EMA triggered LINK pullback amid broad crypto market consolidation.
- Clear rebound from lower BB and 38.2% Fibonacci ratio, amid upbeat Stochastic, favor LINK buyers.
- Daily closing beyond the 200-day EMA is necessary to confirm the reversal of the two-week downtrend.
- Chainlink needs a breakout above $22.70 to reverse yearly losses, with a six-month trendline providing solid downside support.
Chainlink (LINK) price drops over 4.0% intraday to $17.80 early Tuesday, stalling a three-day uptrend after rising the most in over a week the previous day, as crypto market consolidates previous gains amid mixed risk news.
Also read: ChainLink Surges 14% as Whales Snap Up $116M in LINK
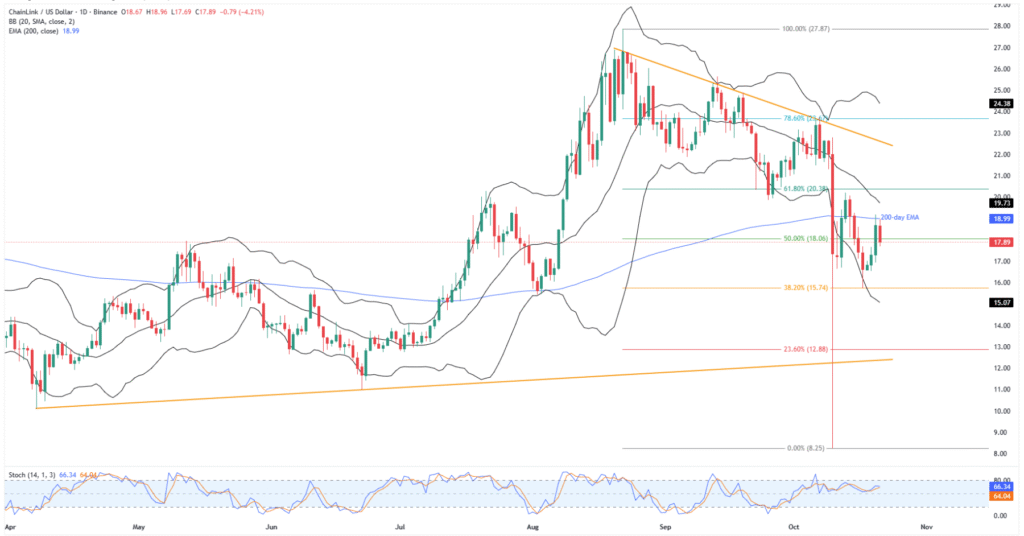
In doing so, the altcoin retreats from the 200-day Exponential Moving Average (EMA) while reversing Friday’s rebound from the lower Bollinger Band (BB) and 38.2% Fibonacci retracement of August-October downside.
While the quote’s latest pullback also drags the market capitalization (market cap), upbeat trading volume and Stochastic momentum indicator keeps the LINK buyers optimistic.
That said, Chainlink’s daily trading volume jumps to a week’s high of $1.36 billion, up for the fourth consecutive day, whereas the market cap retreats from the highest level since October 14 to $12.08 billion by press time, according to Santiment.
Chainlink Price: Daily Chart Lures Buyers

Chainlink’s rebound from the 38.2% Fibonacci retracement level and lower Bollinger Band gains support from upbeat Stochastic conditions to underpin bullish bias, despite its latest retreat from the 200-day EMA.
Given the quote’s latest fall beneath the 50% Fibonacci ratio, the LINK sellers are likely targeting the $17.00 threshold before revisiting the 38.2% Fibonacci retracement levels and the lower BB, respectively near $15.70 and $15.07, quickly followed by the $15.00 threshold.
In a case where the altcoin drops beneath the $15.00 support, it can defy the current bullish bias while approaching the $23.6% Fibonacci level of $12.88, and an ascending trend line from April, close to $12.30, acting as the final line of defense for the LINK buyers.
Alternatively, a daily closing beyond the 200-day EMA hurdle of $19.00 could quickly trigger Chainlink’s rise toward the middle BB of around $19.80 and the $20.00 round figure.
Beyond that, the 61.8% Fibonacci ratio of $20.40 could test Chainlink buyers before directing them to a two-month resistance line surrounding $22.70.
Should LINK prices remain firmer past $22.70, the buyers can aim for the August’s peak of $27.87 and the late 2024 high near $30.95, with the $30.00 round figure likely acting as an intermediate hurdle. With this, the buyers could also reverse the coin’s yearly loss.
Chainlink Price: Four-Hour Chart Highlights $20.40

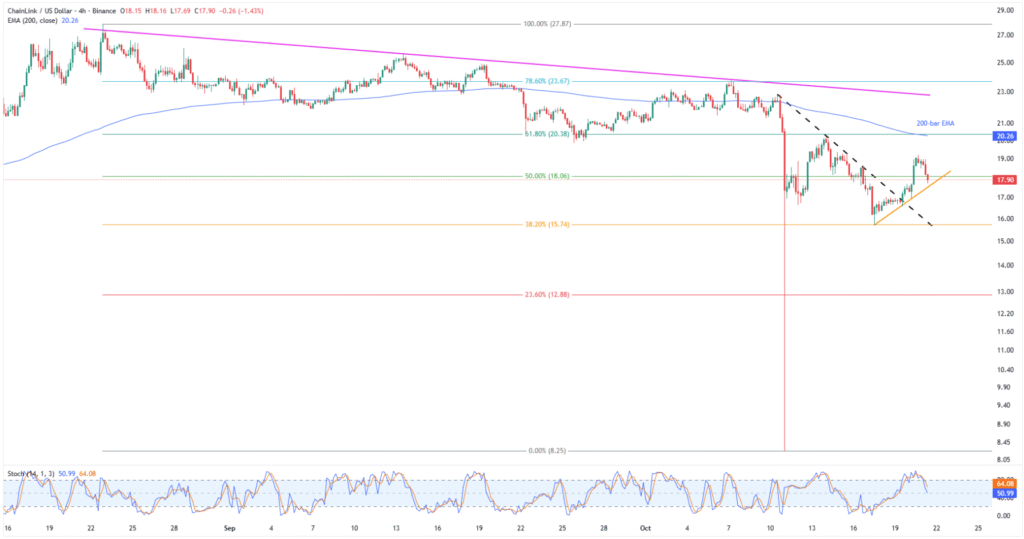
On the four-hour chart, LINK buyers cheer an upside break of a week-long descending trend line resistance, now support near $15.70, while also staying firmer past a four-day ascending support line surrounding $17.40.
Given the Stochastic momentum indicator’s pullback from the overbought territory, the LINK prices may witness further consolidation toward the aforementioned support levels.
However, its further downside will highlight the daily chart’s lower levels.
Meanwhile, Chainlink’s recovery may stall around a convergence of the 200-bar EMA and 61.8% Fibonacci retracement level of Chainlink’s August-October downside, around $20.40.
Following that, higher levels discussed on the daily chart will be on the buyer’s radar.
Conclusion
Chainlink’s recent pullback appears to be a healthy consolidation as the altcoin still defends Friday’s recovery momentum amid upbeat stochastic, allowing buyers to remain hopeful. However, expecting a reversal of the LINK’s yearly loss needs a strong catalyst and a daily closing beyond $22.70. That said, the altcoin’s short-term rise is almost given, but the restoration of a broad bullish trend appears to be uncertain.


