- Chainlink price retreats from a 11-day-high, snapping a two-day winning streak within a six-week bearish channel.
- Sluggish MACD, DMI signals support LINK’s pullback from 21-day SMA to lure short-term sellers.
- Weekly support line, 100-day SMA can test sellers before pushing prices toward the key $19.40 support.
- Chainlink’s three-year bull run holds, despite a potential short-term bearish move.
Chainlink (LINK) price drops over 2.0% intraday to $22.30 early Friday in New York, reversing from over a week’s high while posting the first daily loss in three.
The LINK’s latest retreat could be tied to its failure to cross the 21-day Simple Moving Average (SMA) hurdle, backed by weakening bullish signals from the Moving Average Convergence Divergence (MACD) and Directional Movement Index (DMI) momentum indicators.
Notably, this comes despite growing acceptance of the Chainlink ecosystem and a pullback in the U.S. Dollar due to the government shutdown and dovish Federal Reserve (Fed) bias.
Also read: Chainlink Tokenized Fund Workflows Get SWIFT Integration for UBS
Meanwhile, LINK’s daily trading volume snaps a five-day uptrend while easing to $919.29 million, whereas the market capitalization (market cap) also drops to $15.12 billion, according to Santiment. This hints at reduced trader activity during the recent pullback.
That said, with Chainlink showing a solid three-year uptrend, a clear confirmation is needed to solidify the bearish trend.
Chainlink Price: Daily chart suggests further downside

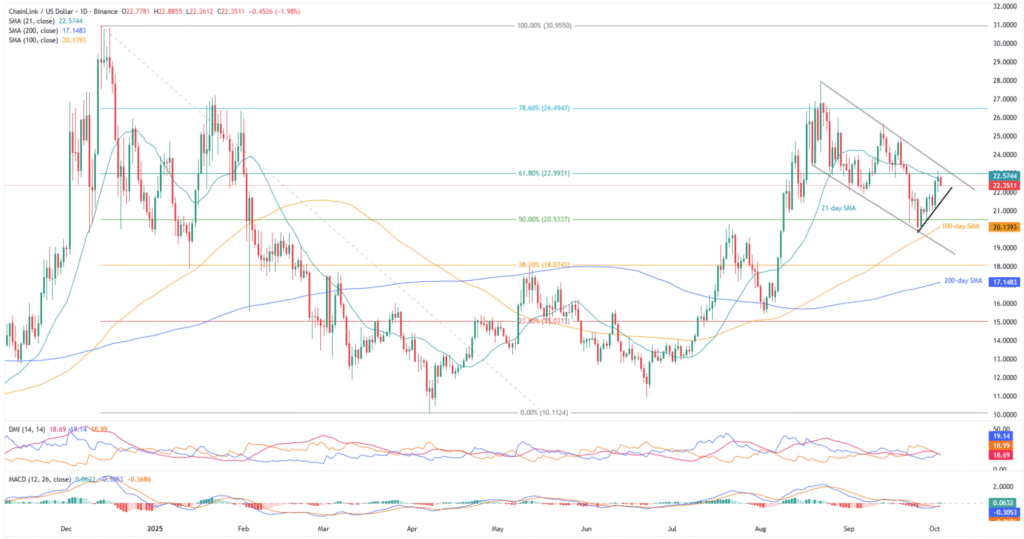
A six-week-old bearish trend channel, combined with LINK’s rejection at the 21-day SMA, is attracting short-term sellers. Meanwhile, weak MACD signals and uncertain DMI indicators are adding to the bearish sentiment, tempting more traders to sell.
The DMI’s three lines, Upmove (D+, blue), Downmove (D-, orange), and ADX (red), are all stuck below the 25.00 neutral level, hovering around 20.00. This shows weak momentum, further enticing LINK bears to take action.
This highlights a week-long support line surrounding $21.70 as an immediate target for Chainlink sellers, a break of which could shift the market’s attention to the 100-day SMA support of $20.15 and then to the $20.00 threshold.
Above all, the stated channel’s bottom surrounding $19.80 appears to be the last line of defense for the LINK buyers, a break of which could make prices vulnerable to slump toward the 200-day SMA support of $17.15.
On the contrary, a daily closing beyond the 21-day SMA of $22.57 will need validation from the stated bullish channel’s upper boundary, near $23.50, to recall the buyers.
In that case, tops marked during September and August, respectively near $25.65 and $27.85, may test the LINK bulls before directing them toward the late 2024 peak of $30.95. Notably, the $30.00 round figure may act as an extra upside filter during the potential rise past $27.85.
Chainlink Price: Four-Hour Chart Suggests Short-Term Consolidation

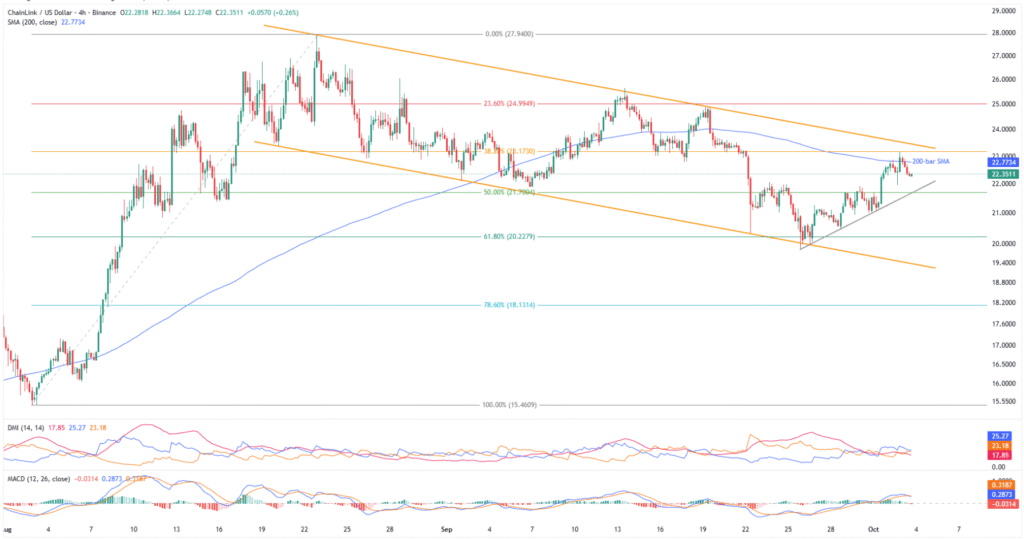
On the four-hour chart, MACD and DMI momentum indicators are slightly upbeat, but the quote’s retreat from the 200-bar SMA and a multi-week bearish channel keep sellers optimistic.
That said, a downside break of the week-long support line surrounding $21.70 could direct prices to the 61.8% Fibonacci retracement of the LINK’s August upside, near $20.22.
However, the stated channel’s bottom of $19.80 and deeper levels discussed on the daily chart could challenge Chainlink sellers afterward.
Alternatively, the 200-bar SMA guards the LINK’s immediate upside near $22.78 before the 38.2% Fibonacci ratio of $23.17 and the stated channel’s top of around $24.50.
Beyond that, higher levels discussed on the daily chart will be in the spotlight.
Conclusion
Chainlink’s recent pullback from the key short-term moving average, backed by slow momentum indicators and a bearish channel, points to a potential consolidation phase within its three-year uptrend.
Also read: Crypto Morning News: Bitcoin Climbs to 121K as U.S. Shutdown Boost Fed Cut Bets


