- Dogecoin retreats from 14-day EMA, fading bounce off 15-week support, but snaps five-week losing streak.
- Momentum indicators maintain bearish tone, signaling slow descent toward the last major support before DOGE’s yearly bottom.
- DOGE buyers face long road to retaking control, $0.21 acts as the last defense of bears.
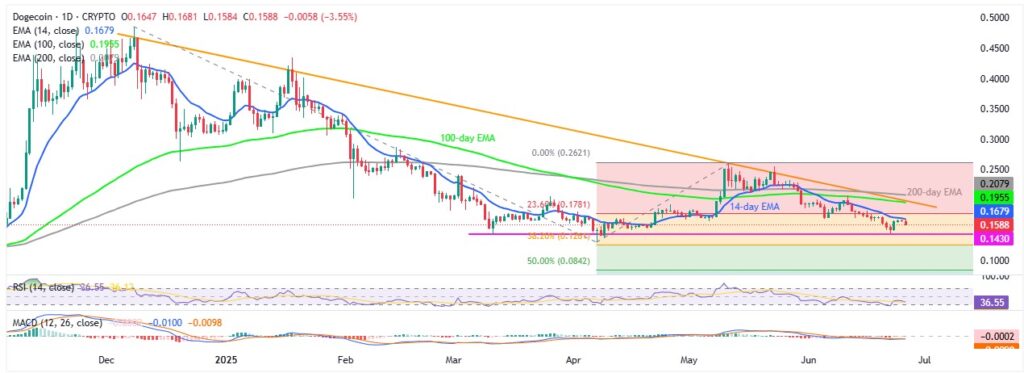
Dogecoin (DOGE/USD) dropped to an intraday low near $0.1600 during Thursday’s U.S. session, extending the previous day’s decline from the 14-day Exponential Moving Average (EMA) resistance. The recent price action shows DOGE failing to hold last week’s rebound off a critical horizontal support that guards the yearly low. So far in 2025, DOGE has fallen nearly 50%.
That said, momentum indicators like the 14-day Relative Strength Index (RSI) and Moving Average Convergence Divergence (MACD) are also signaling bearish strength, encouraging sellers as the key support at $0.1430 comes under renewed pressure.
DOGE/USD: Daily chart favors bears

Source: Tradingview
DOGE/USD looks set to test the key horizontal support near $0.1430 after reversing from the 14-day EMA and without the RSI reaching oversold levels.
While the MACD signals remain unclear, the RSI’s closeness to the oversold line around 30 suggests a possible bounce from this support. If that fails, the yearly low of $0.1300 could come under threat, followed by deeper support zones near $0.1010 and $0.0800 from October and August 2024, which may attract more selling pressure.
On the upside, DOGE needs to clear the 14-day EMA resistance around $0.1680 to confirm a recovery. Beyond that, the bulls face further tests at the 100-day EMA and a descending trend line near $0.1955–$0.1970, before reaching the bears’ last line of defense at the 200-day EMA around $0.2080.
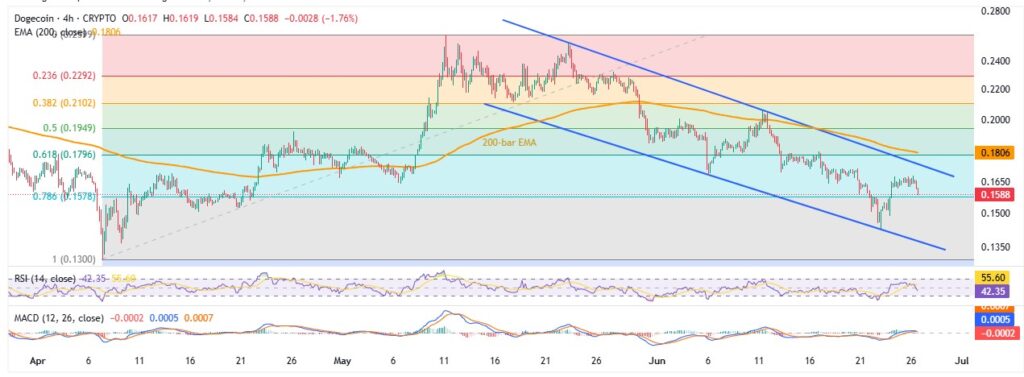
DOGE/USD: Four-Hour chart hints at limited downside room

Source: Tradingview
On the four-hour chart, DOGE/USD is trading within a five-week descending channel, currently testing the 78.6% Fibonacci retracement of its April-May rally near $0.1580.
Below that, the channel’s lower boundary around $0.1375 could attract more selling, adding to the daily chart support levels.
Alternatively, short-term recovery faces resistance at the channel’s top near $0.1745 and the 200-bar EMA around $0.1810, which must be breached before bulls can take control and challenge higher daily levels.
Overall, Dogecoin looks poised to revisit key yearly support, though further downside appears limited.


