- Dogecoin price slides 4.0% intraday after hitting short-term key resistance, snapping three-day uptrend.
- Bearish signals from MACD and DMI momentum indicators suggest DOGE sellers may target $0.2060 and 200-day SMA support.
- Recovery remains elusive below the five-week resistance line, while a multi-month consolidation pattern limits Dogecoin’s major moves.
- Short-term weakness possible for DOGE, but multi-month sideways movement likely to continue.
Dogecoin (DOGE) price drops over 4.0% intraday to $0.2140 as sellers return on Friday after a three-day absence.
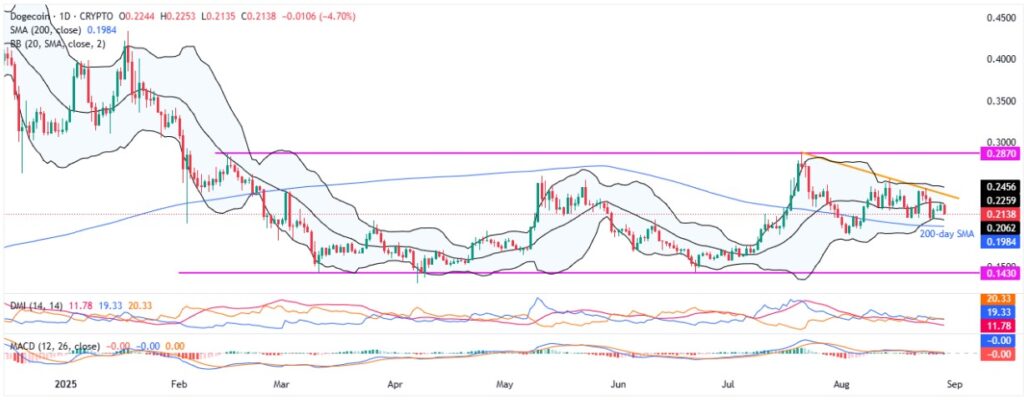
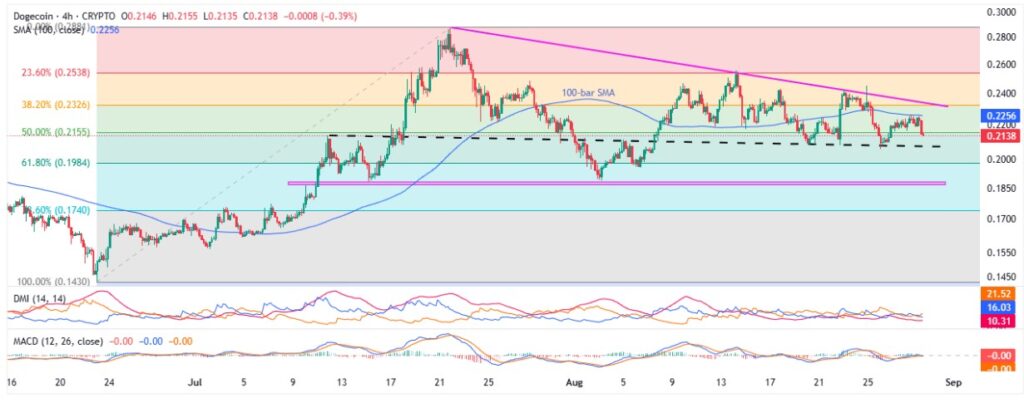
In doing so, the memecoin takes a U-turn from the middle Bollinger Band (BB) on the daily chart, and also reverses from the 100-bar Simple Moving Average (SMA) on the four-hour projection.
Notably, bearish signals from the momentum indicators like the Moving Average Convergence Divergence (MACD) and the Directional Movement Index (DMI) add to the Dogecoin seller’s hopes for revisiting the weekly low.
Still, downbeat trading volume and market capitalization joins a slew of strong support levels, as well as a broad trading range since February, to challenge the DOGE bears.
That said, Dogecoin’s daily trading volume remains near the lowest level in three weeks, as marked the previous day, despite ticking a bit upwards to $1.93 billion by press time. Further, the coin’s market cap retreats to $32.41 billion, according to Santiment.
Hence, Dogecoin is likely to witness a short-term pullback in prices, but the overall sideways performance of the quote may hold.
Dogecoin Price: Daily Chart Lures Short-Term Sellers

A clear U-turn from the middle BB joins the bearish MACD signals to favor the DOGE sellers as they snap a three-day winning streak.
Bearish signals from the DMI add strength to the downside bias, with the Downmove line (D- in orange) and the Upmove line (D+ in blue) nearing the neutral 25.00 level, with the latest prints close to 20.00. However, the Average Directional Index (ADX in red) remains weak around 11.00, favoring short-term sellers despite showing a lack of strong momentum.
With this, DOGE sellers seem poised to test the lower Bollinger Band around $0.2060, but further downside is likely to be capped by the 200-day SMA support at $0.1984, along with the key $0.2000 psychological support.
If the Dogecoin price breaks the 200-day SMA support, it could quickly target the monthly low at $0.1886, eventually heading toward the bottom of a 6.5-month trading range surrounding $0.1430.
On the contrary, a daily closing beyond the middle BB hurdle of $0.2260 could allow the DOGE buyers to confront a five-week resistance line near $0.2380.
Still, Dogecoin buyers may face resistance near the upper Bollinger Band and monthly high, respectively around $0.2455 and $0.2560. Beyond that, the multi-month range top at $0.2870 and the $0.3000 psychological level will be in the spotlight.
Dogecoin Price: Four-Hour Chart Highlights Triangle Pattern

A seven-week-old descending triangle formation, currently between $0.2350 and $0.1880, restricts short-term DOGE moves on the four-hour chart.
That said, a slightly descending trend line from July 11 restricts immediate downside near $0.2060, whereas the 100-bar SMA near $0.2256 guards the quote’s immediate recovery moves.
It’s worth noting that the DMI indicator flashes comparatively stronger bearish signals on the four-hour chart, with the Downmove line (D- in orange) closer to the 25.00 mark than the Upmove and ADX line.
In a case where Dogecoin breaks the $0.1880 support, multiple levels around $0.1560-$0.1550 may act as additional downside filters before shifting the market’s attention to the daily chart levels.
Meanwhile, an upside clearance of $0.2350 will need validation from the $0.2380 resistance mentioned on the daily chart to convince buyers to target the higher levels.
Conclusion
The Dogecoin price is facing short-term weakness with bearish signals suggesting a pullback to $0.2060. However, key supports at $0.2000 and the 200-day SMA may limit the quote’s further downside.
Overall, the broader sideways trend is likely to continue, with DOGE buyers eyeing resistance near $0.2455-$0.2560 for potential upside.
Also read: Offshore Crypto Exchanges are Now Welcome for U.S. Traders per CFTC Advisory


