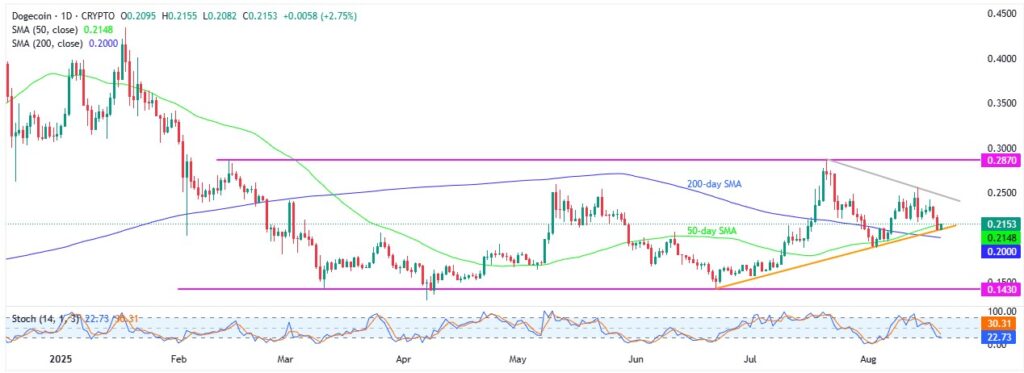
- Dogecoin price consolidates weekly losses two-week low, posting its first gain in three days, as key support joins market’s positioning for top-tier catalysts.
- Nearly oversold Stochastic and two-month support trigger DOGE’s corrective bounce, but 50-day SMA tests recovery moves.
- 200-day SMA acts as a strong downside filter for Dogecoin within a six-month trading range.
- DOGE may see short-term consolidation, but overall range-bound trading is likely to continue.
Dogecoin (DOGE) price rises for the first time in three days, reaching $0.2140 early Wednesday, while bouncing off a two-month support level. The DOGE’s latest rebound reflects the market’s consolidation ahead of this week’s key data releases and events, supported by technical indicators signaling potential short-term strength.
Read More: Market Digest: Bitcoin Dips to 113K amid Ukraine Talks and Fed Caution
Additionally, the memecoin’s recovery is backed by a five-day high trading volume, boosting short-term buyer confidence. That said, DOGE’s daily volume rose to $3.26 billion, according to Santiment, while market cap rose from a two-week low to $32.23 billion.
Still, the 50-day Simple Moving Average (SMA) and several resistance levels limit the DOGE’s further gains within its six-month trading range.
Dogecoin Price: Daily Chart Favors Corrective Bounce

Dogecoin’s bounce off a two-month ascending support is supported by a nearly oversold Stochastic near 22.00, signaling that the rebound may continue.
However, a daily closing beyond the 50-day SMA hurdle of $0.2150 becomes necessary for the DOGE buyer’s return, even for the short term. Should this happen, the following run-up can aim for a month-old trend line resistance surrounding $0.2480.
Beyond that, the monthly high around $0.2560, May’s peak of $0.2595, and the six-month trading range top near $0.2870 will be crucial challenges for the DOGE bulls to surpass before taking control.
Alternatively, if DOGE fails to hold the ascending trend line support from June, close to $0.2080 at the latest, it will have another chance at a rebound as the 200-day SMA stands at the $0.2000 psychological magnet.
If downside pressure continues past $0.2000, the quote’s gradual fall toward the August 3 low of $0.1885 and May’s trough surrounding $0.1645 might test the bears before challenging them with the six-month range floor, near $0.1430. Also acting as the short-term key support is the yearly low of $0.1300.
Dogecoin Price: Four-Hour Chart Appears Less Bullish

Dogecoin’s four-hour chart shows weaker bullish signs compared to the daily. The price remains below the 100-bar SMA, after breaking a three-week-old ascending trend channel. Additionally, the Stochastic indicator sits just above the oversold threshold, pointing to weak momentum behind the current corrective bounce.
Even if the DOGE crosses the 100-bar SMA hurdle of $0.2236 and reclaims the broken channel support of $0.2300, buyers will still face resistance from the monthly high near $0.2560, the stated channel’s top of $0.2730, and July’s peak of $0.2875.
It’s worth noting that the quote’s successful trading past $0.2875 will highlight the daily chart levels for bulls.
On the flip side, a six-week-old horizontal area surrounding $0.1880-$0.1870 acts as the short-term key support, a break of which will direct Dogecoin sellers toward the deeper levels discussed on the daily chart.
Conclusion
Dogecoin bounces off short-term support as nearly oversold momentum oscillators and the market’s positioning for the key events support a recovery. The rebound, however, could be short within the six-month trading range, allowing sellers to discount the latest DOGE price strength.
Also read: Concordium Launches Zero-Knowledge App for Privacy-Focused Identity Verification


